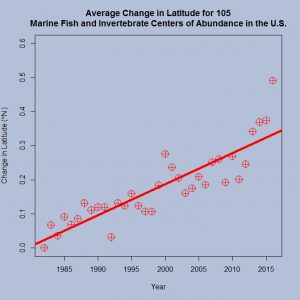
Ocean Adapt from Rutgers School of Environmental and Biological Sciences has online materials that allow you to explore changes in marine species distribution. For example, the graph here was produced from their National Data page. The graph represents the average change in latitude for 105 marine fish and invertebrate centers of abundance in the U.S. The data is particularly useful to use in a classroom because the residual plot is interesting.
The site also includes changes in depth as well as regional data where one can explore changes for specific marine species in a given region. Along with accessible data, the pages provide interactive graphs and a quick pdf guide on how to use the site.
NOTE: Sustainability Math now has a Twitter account, @SustMath, and Facebook page, Sustainability Math.