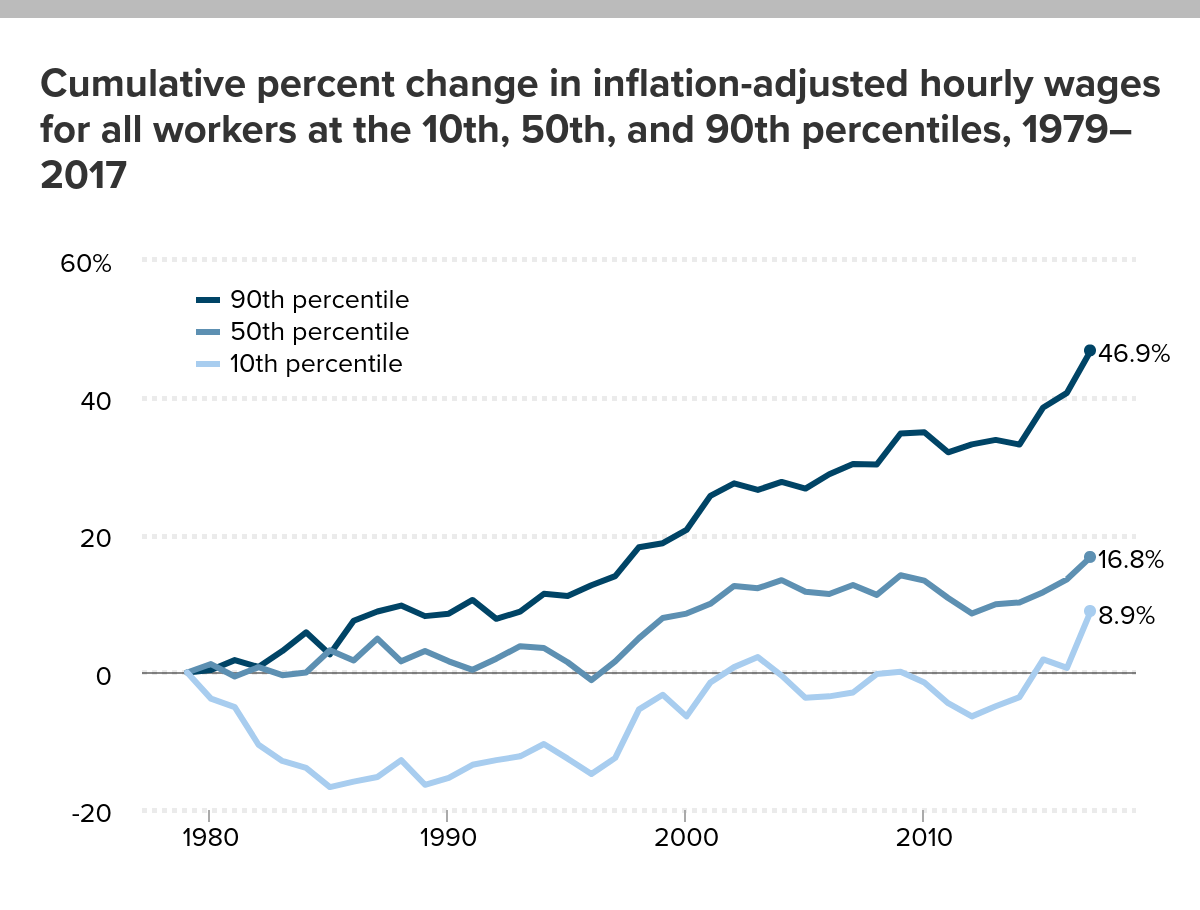
Wage growth has varied depending on numerous factors such as gender, race, income level, and education. The EPI article, America’s slow-motion wage crisis-Four decades of slow and unequal growth by John Schmitt, Elise Gould, and Josh Bivens (9/13/18) summarizes the findings with 30 graphs or tables (data included). For example, the cumulative percent change in inflation-adjusted hourly wages for workers in the 10th, 50th, and 90th percentile is given in the graph here (downloaded from the article).
The first key trend since 1979 is the historically slow growth in real wages. In 2017, middle-wage workers earned just 16.8 percent more than their counterparts almost four decades earlier. This corresponds to an annualized inflation-adjusted growth rate over the 38-year period of just 0.4 percent per year. The real wage increase for low-wage workers (those at the 10th percentile) was even slower: 8.9 percent over 38 years, or a 0.2 percent annualized growth rate.
This slow growth is particularly disappointing for two reasons. First, as we will see in the next section, U.S. workers today are generally older (and hence potentially more experienced) and substantially better educated than workers were at the end of the 1970s.10 Second, for workers at the bottom and the middle, most of the increase in real wages over the entire period took place in the short window between 1996 and the early 2000s. For the large majority of workers over the last four decades, wages were essentially flat or falling apart from a few short bursts of growth.
Quiz Questions: What was the cumulative change in hourly wages from 1979 to 2017 for
- What was the cumulative change in hourly wages from 1979 to 2017 for workers with an advanced degree?
- What was the cumulative change in hourly wages from 1979 to 2017 for workers with less than a high school diploma?
- Which ethnic group had the greatest change?
- What was the cumulative change in hourly wages from 1979 to 2017 for Women in the 50th percentile?
- What was the cumulative change in hourly wages from 1979 to 2017 for Men in the 50th percentile?
The article and/or corresponding data is ready for use in a stats or QL course in the 90th percentile.
Answers: (1) 30.0% (2) -9.6% (3) Asian American/Pacific Islander non-Hispanic 23.3% (4) 33.8% (5) 8.1%.