 The first two interactive graph have been posted at sustainabilitymath.org. They can be found at the new Interactive Graphs page. The two graph represent mean and median wages by race and gender with regression lines from 1973 to 2017 (data from EPI). Check them out because they are interesting and both could be used in a QL or stats course.
Tags charts and graphs data source social justice
About Thomas J. Pfaff
Check Also
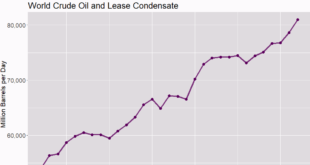
Is the world using less fossil fuels?
Nope. Wind and solar energy have increased, but so have coal, natural gas, and oil. …