This recent video (3/29/19) by Robert Rohde shows how temperature distributions have changed. Each year the graph is a distribution of temperature anomalies. As noted “This essentially the same data that was previous shown as an animated map:” https://www.youtube.com/watch?v=JObGveVUz7k The video here is useful in any statistics or QL course and the two videos together provide an illustration of how to display data. The data is from Berkeley Earth.
Tags charts and graphs QL statistics
About Thomas J. Pfaff
Check Also
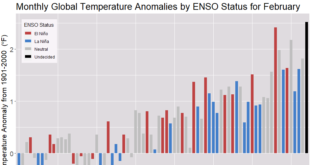
How hot was February 2024?
Here is the February anomaly showing that 2024 was barely a record anomaly for February, …