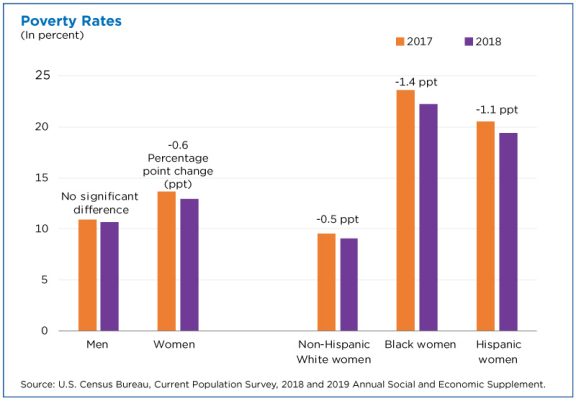
The U.S. Census Bureau report Income and Poverty in the United States: 2018 by Jessica Semega, Melissa Kollar, John Creamer, and Abinash Mohanty (9/10/19) is now available. A few highlights can be found in the post Pay is Up. Poverty is Down. How Women are Making Strides by Jessica Semega (9/10/19). For example, the graph copied here is poverty rates for 2917 and 2018 for men, women, and by race for women. In terms of households:
Median incomes of married-couple households and those with male householders did not change from 2017.
In 2018, the poverty rate for families with a female householder was 24.9%, higher than that for married-couple families (4.7%) and families with a male householder (12.7%).
However, the poverty rate for families with a female householder declined from the previous year, at 26.2% in 2017.
The full report contains 20 pages of charts and summaries related to income and poverty by numerous categories. The other 50 or so pages are data tables that are also available in excel files (see links on right sidebar of the report page). There is ample data here for use in courses.