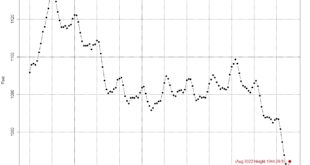
The United States Drought Monitor provides weekly updates of drought in the U.S. Maps such as the one here can be downloaded. For classroom use there is a data page where full data sets can be downloaded including GIS data. There is also an interactive time series graph.
Read More »How much of the U.S. is in drought?
The United States Drought Monitor is your source for drought information. Starting with the main graph, copied here, you can select regions and then down to state levels. From the data tab you can select time series graphs, download tabular data by selected region, as well as obtain GIS files. …
Read More »