How much have cod catches in Eastern Canada changed?

Our World in Data has an extensive post on Fish and Overfishing by Hannah Ritchie and Max Roser (first published Oct 2021). Here is one excerpt from this article:

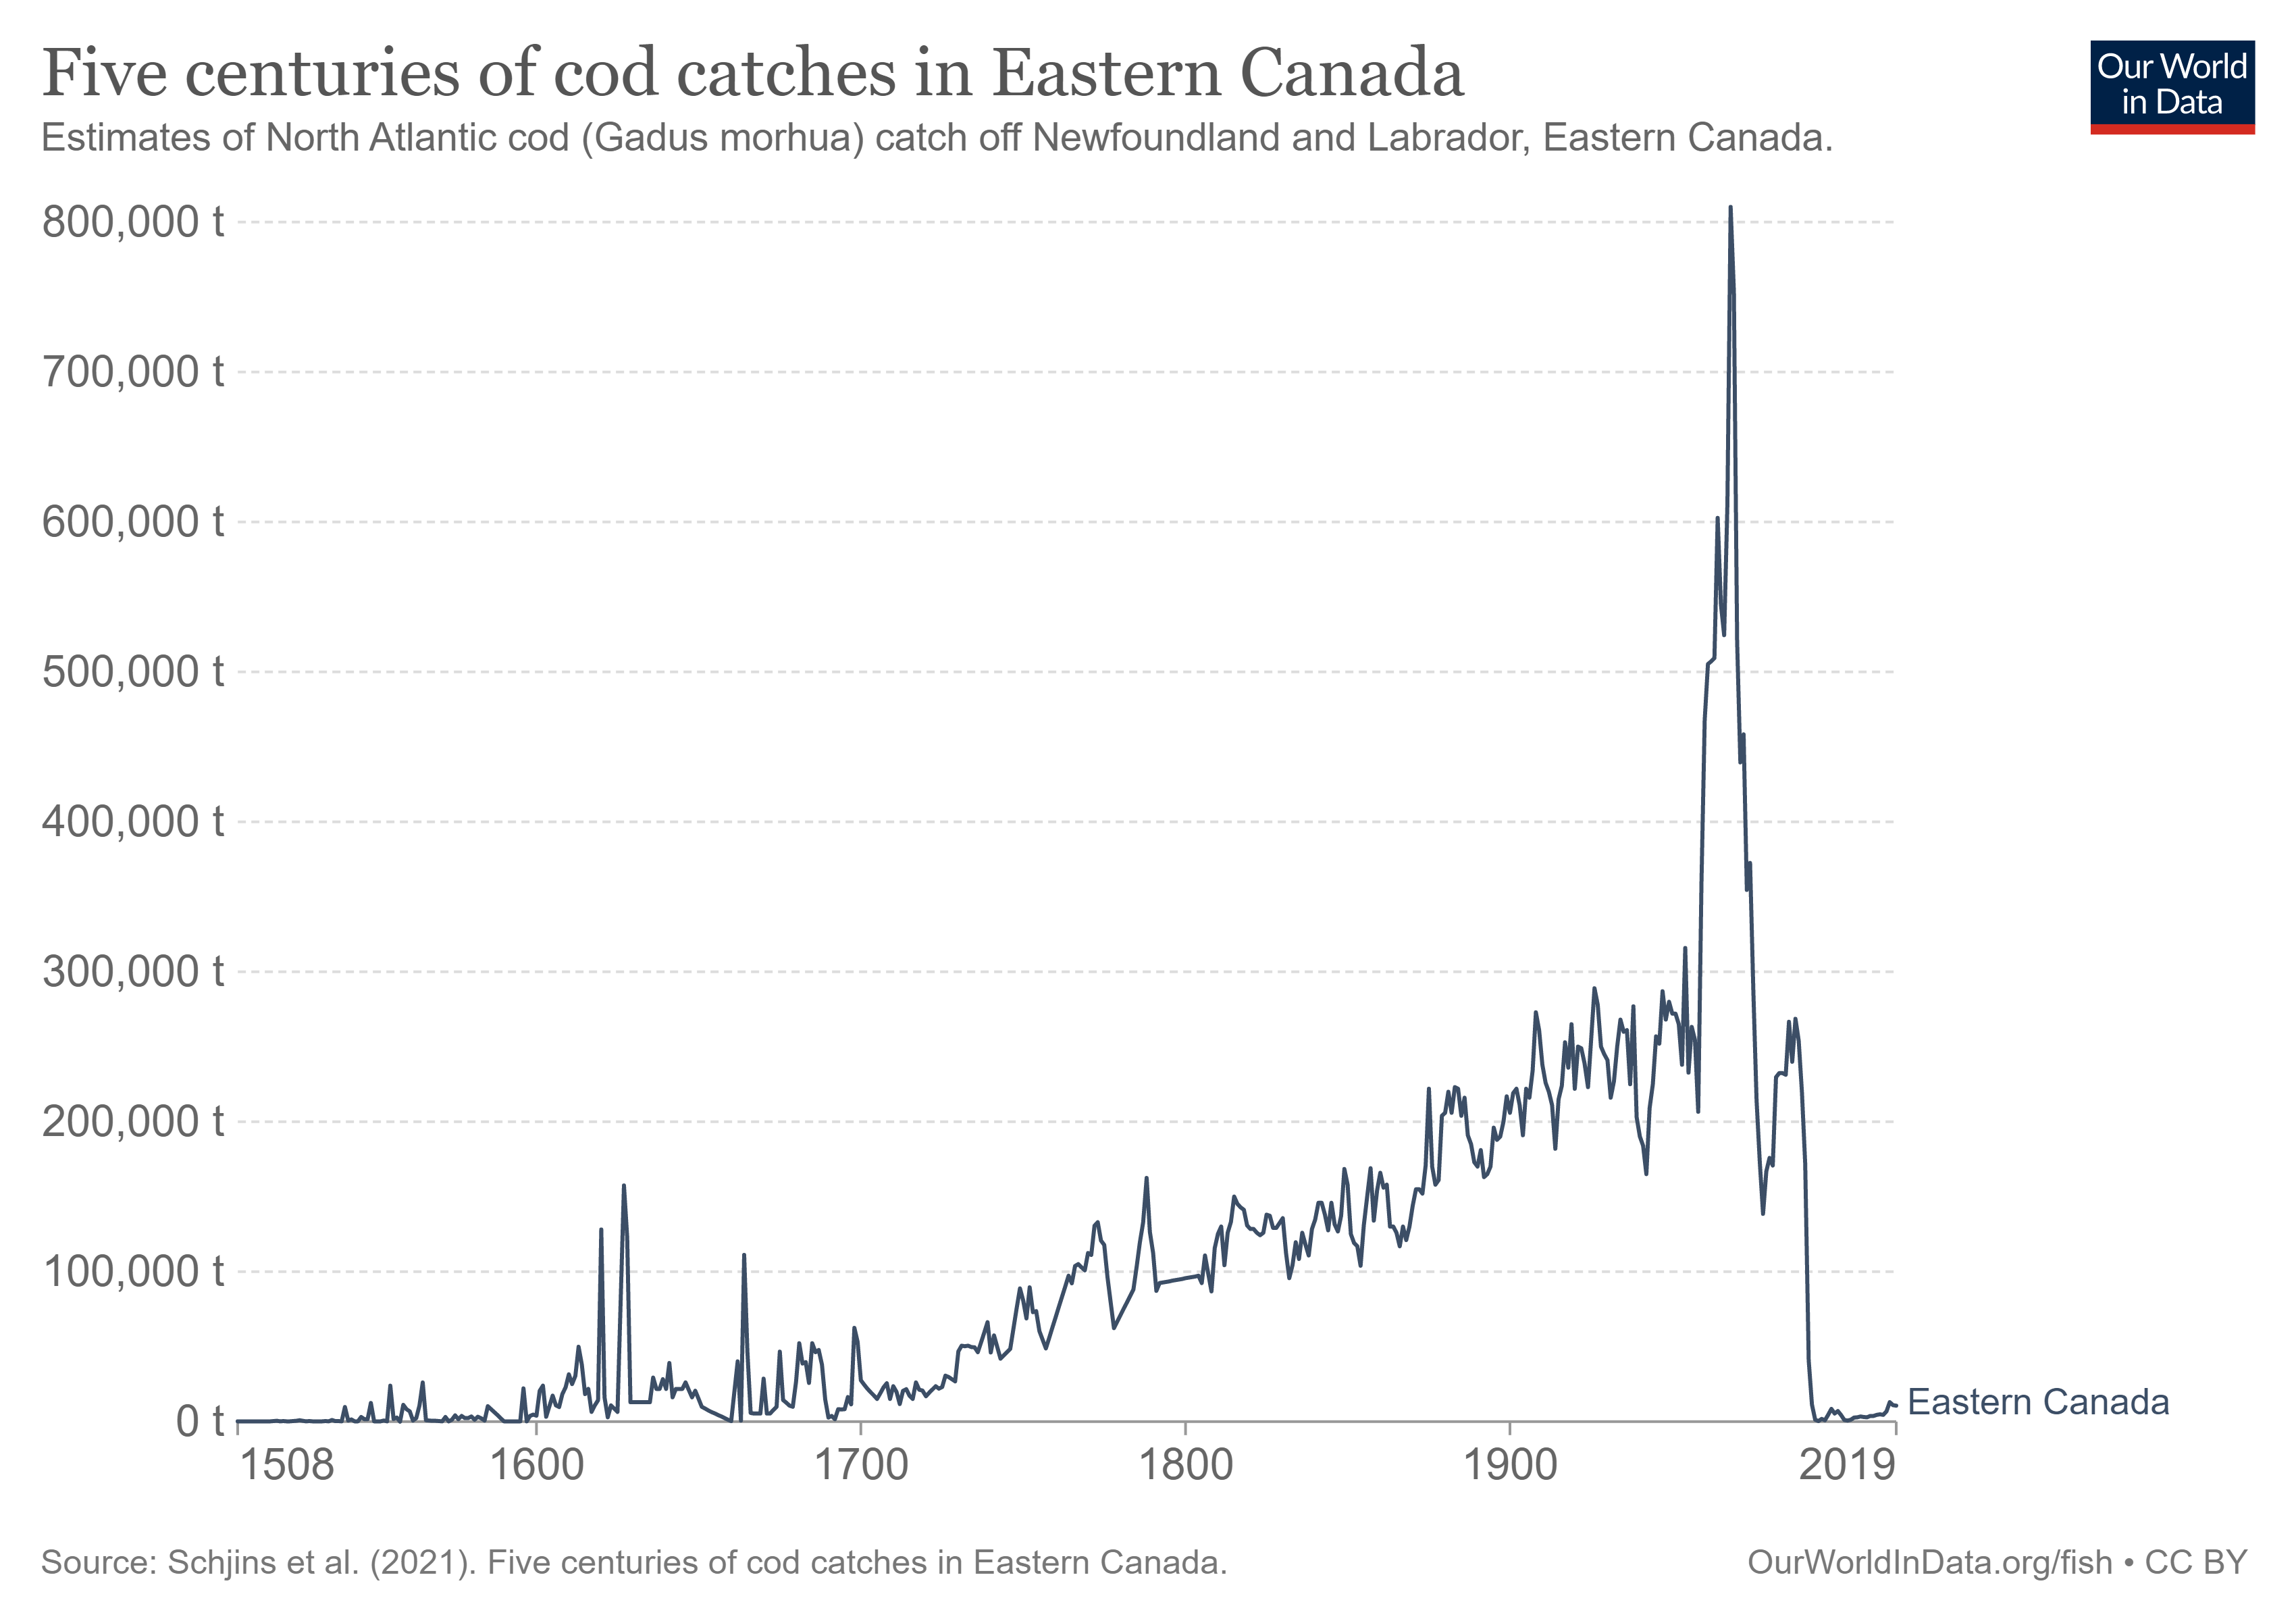
In the chart here we see five centuries of cod catch in Eastern Canada. These fishing records date back to the year 1500. We see that fish catch started to increase from around 1700 through to the mid-20th-century. It peaked in 1968, before a collapse in fish stocks led to a dramatic decline. In fact, fisheries were forced to close 24 years later, in the early 1990s. Since then, stocks have not been able to recover due to the reopening of fisheries and their overexploitation afterwards.

You can download the data for this chart and more than a dozen others in the post.


How divided is the U.S.?

The Pew report Diversity and Division in Advanced Economies by Laura Silver, Janell Fetterolf, and Aidan Connaughton (10/13/2021) has the U.S. is the top spot in a poll and not in a good way.  The chart copied here from Pew has the U.S. at the top for conflict between political parties and even the second highest response from the U.S. would be third in the most common response.

Notably, however, in most societies racial and ethnic divisions are not seen as the most salient cleavage. Rather, in the majority of places surveyed, more people identify conflicts between people who support different political parties than conflicts between people with different ethnic or racial backgrounds. Political divisions are also seen as greater than the other two dimensions tested: between those with different religions and between urban and rural residents. (For more on the actual composition of each public surveyed on each of these dimensions, see Appendix A.)

The report has over 20 charts and rich context to discuss the quantitative results.

How hot was Sept 2021?

From NOAA’s Global Climate Report – September 2021:

The global surface temperature for September 2021 was 0.90°C (1.62°F) above the 20th century average of 15.0°C (59.0°F) and was the fifth highest September temperature in the 142-year record. Only Septembers of 2015, 2016, 2019, and 2020 had a higher September temperature departure. The eight warmest Septembers have all occurred since 2014. September 2021 also marked the 45th consecutive September and the 441st consecutive month with temperatures, at least nominally, above the 20th-century average.

Some regional highlights:

The Southern Hemisphere’s September 2021 surface temperature departure of +0.70°C (+1.26°F) was the warmest September in the 142-year record, surpassing the previous record set in 2018 by 0.02°C (0.04°F).

According to NCEI’s continental analysis, Africa had its warmest September on record at 1.50°C (2.70°F) above average, surpassing the previous record set in 2017 by 0.07°C (0.13°F).

September 2021 was also South America’s warmest September on record at +1.94°C (+3.49°F). This value exceeded the previous record set in 2015 by 0.23°C (0.41°F).

Time series data is available near the top of the page.

How did COVID impact K-12 learning based in income?

The Pew article What we know about online learning and homework gap amid the pandemic by Katherine Schaeffer (10/1/2021) has this to say:

Parents with lower incomes whose children’s schools closed amid COVID-19 were more likely to say their children faced technology-related obstacles while learning from home. Nearly half of these parents (46%) said their child faced at least one of the three obstacles to learning asked about in the survey, compared with 31% of parents with midrange incomes and 18% of parents with higher incomes.

This technology divide isn’t new:

Even before the pandemic, Black teens and those living in lower-income households were more likely than other groups to report trouble completing homework assignments because they did not have reliable technology access. Nearly one-in-five teens ages 13 to 17 (17%) said they are often or sometimes unable to complete homework assignments because they do not have reliable access to a computer or internet connection, a 2018 Center survey of U.S. teens found.

There are four other charts in the article.

How does climate impact Arctic communities?

The graph here is from the paper Co-production of knowledge reveals loss of Indigenous hunting opportunities in the face of accelerating Arctic climate change in Environmental Research by Donna D W Houser, et. el. (8/24/2021). From the discussion:

Overall, our analyses indicate that the ugruk harvesting season for Qikiqtaġruŋmiut hunters is being compressed by the shorter spring ice breakup period. Indeed, if we summarize across our time-series from 2003 to 2019, Kotzebue Sound now clears of sea ice ∼22 d earlier (figure S3) and is the primary factor contributing to a shrinking ugruk hunting season.

A new Indigenous-led study documents how ice loss is changing seal hunts by Yereth Rosen (9/6/2021) is non-technical summary of the paper and when an article has a rate in it we can use it in calculus:

From 2003 to 2019, the seal hunting season diminished by about a day a year, with most of that change happening at the end of the season, according to the study, published in the journal Environmental Research Letters.

How much CO2 have we emitted in the last 30 years?

The Institute for European Environmental Policy had this post that I missed in 2020 but it is still good: More than half of all CO2 emissions since 1751 emitted in the last 30 years (4/29/2020).

Slightly over half of all cumulative global CO2 emissions have taken place since 1990, the year of the first IPCC Assessment Report. The report re-confirmed anthropogenic climate change in a way that could not be ignored and led to the creation of the UNFCCC.

As a project you can do something similar comparing China and the U.S. using the U.S. and China CO2 Emissions projects under Calculus Projects.

Southwest drought, bad luck or more to come?

From the climate.gov article NOAA-led drought task force concludes current Southwest drought is a preview of coming attractions by Rebecca Lindsey (9/23/2021):

The team found that the record-low precipitation that kicked off the event could have been a fluke—just the rare bad luck of natural variability. But the drought would not have reached its current punishing intensity without the extremely high temperatures brought by human-caused global warming.

The key points:

The cumulative precipitation for the 20-month period was the lowest on record, dating back to 1895. That left almost the entire western half of the contiguous United States in some level of drought at the end of August.

and

Meanwhile, the average temperatures over the same 20-month period were near-record high. High temperatures make the atmosphere thirsty for moisture, which it draws vigorously out of the region’s soil, rivers, lakes—even the snowpack. This atmospheric demand, called a vapor pressure deficit (“VPD” for short), reached record highs during the current drought.

No relief in site:

As for when the current event will break, the task force warns that it’s unlikely to be this winter. Thanks in part to the expectation that La Niña will settle into the tropical Pacific by later this fall, odds are that winter precipitation across the Southwest will be below average once again. That means the drought will likely persist well into 2022, and perhaps longer, depending on how unfavorable the coming wet season is.

There is a link to the full report for those interested.

Did COVID-19 impact births?

The U.S. Census Bureau article U.S. Births Declined During the Pandemic by Anne Morse (9/21/2021) has the data.

However, comparing one month during the pandemic to the same month before the pandemic shows a substantial drop that can’t be explained by seasonality.

There were 285,138 births in December 2020 — 23,664 (7.66%) fewer than in December 2019. On average, there were 763 fewer births each day in December 2020 than in December 2019.

But,

Not all of the decrease in births should necessarily be attributed to the pandemic. The number of U.S. births has been declining every year since 2008 (except 2014).

Between 2000 and 2019, the number of daily births declined an average 0.39% a year. The pace of decline accelerated between 2010 and 2019, when the number of daily births dropped on average 0.96% a year.

But the decline was much steeper in in 2020: The average number of daily births was 4.06% lower than in 2019.

There is a table of data in the article and sources are cited for the data.

How do we explore invasive aquatic species in the Great Lakes basin?

The Great Lakes Aquatic Nonindigenous Species Information System (GLANSIS) is

designed to to be a “one-stop shop” for information about non-native species in the Great Lakes. GLANSIS hosts regional data about identification, ecology, distribution, environmental and socioeconomic impacts, management, and control of nonindigenous species throughout the Great Lakes basin, along with bibliographic material, risk assessments, and other resources.

If you click on Map Explorer you can make the map here which shows the distribution of Bythotrephes longimanus (Spiny Waterflea – orange) and Echinogammarus ischnus (scud – blue). One nice thing about the Map Explorer is you can easily download a csv file of the data which includes lat long  coordinates (use it in your favorite GIS software). There are also dates so the data can be used as a time series.  Using the GLANSIS Map Explorer by El Lower, Austin Bartos, and Rochelle Stuttevant (8/11/2021) provides an nice intro to the site.