Were can we find climate related training courses?

Climate.gov has a training courses page. If you filter by type of training you’ll see there are 35 online self-guided courses.

The training courses here can help you acquire the tools, skills, and knowledge you need to manage your climate-related risks and opportunities. All courses are free of charge, and are offered in at least one of three formats: online audio-visual presentations (“Online, Self-Guided” and “Tool Tutorial”), training webinars (“Online, Scheduled Lecture Series”), and residence training courses (“Onsite, Instructor-Led”). Each training module is accompanied with a test to help you evaluate your knowledge. These courses feature scientific information adapted from authoritative sources, prepared by recognized subject matter experts. The courses have been pilot tested with users and other subject matter experts and may be updated periodically, as needed.

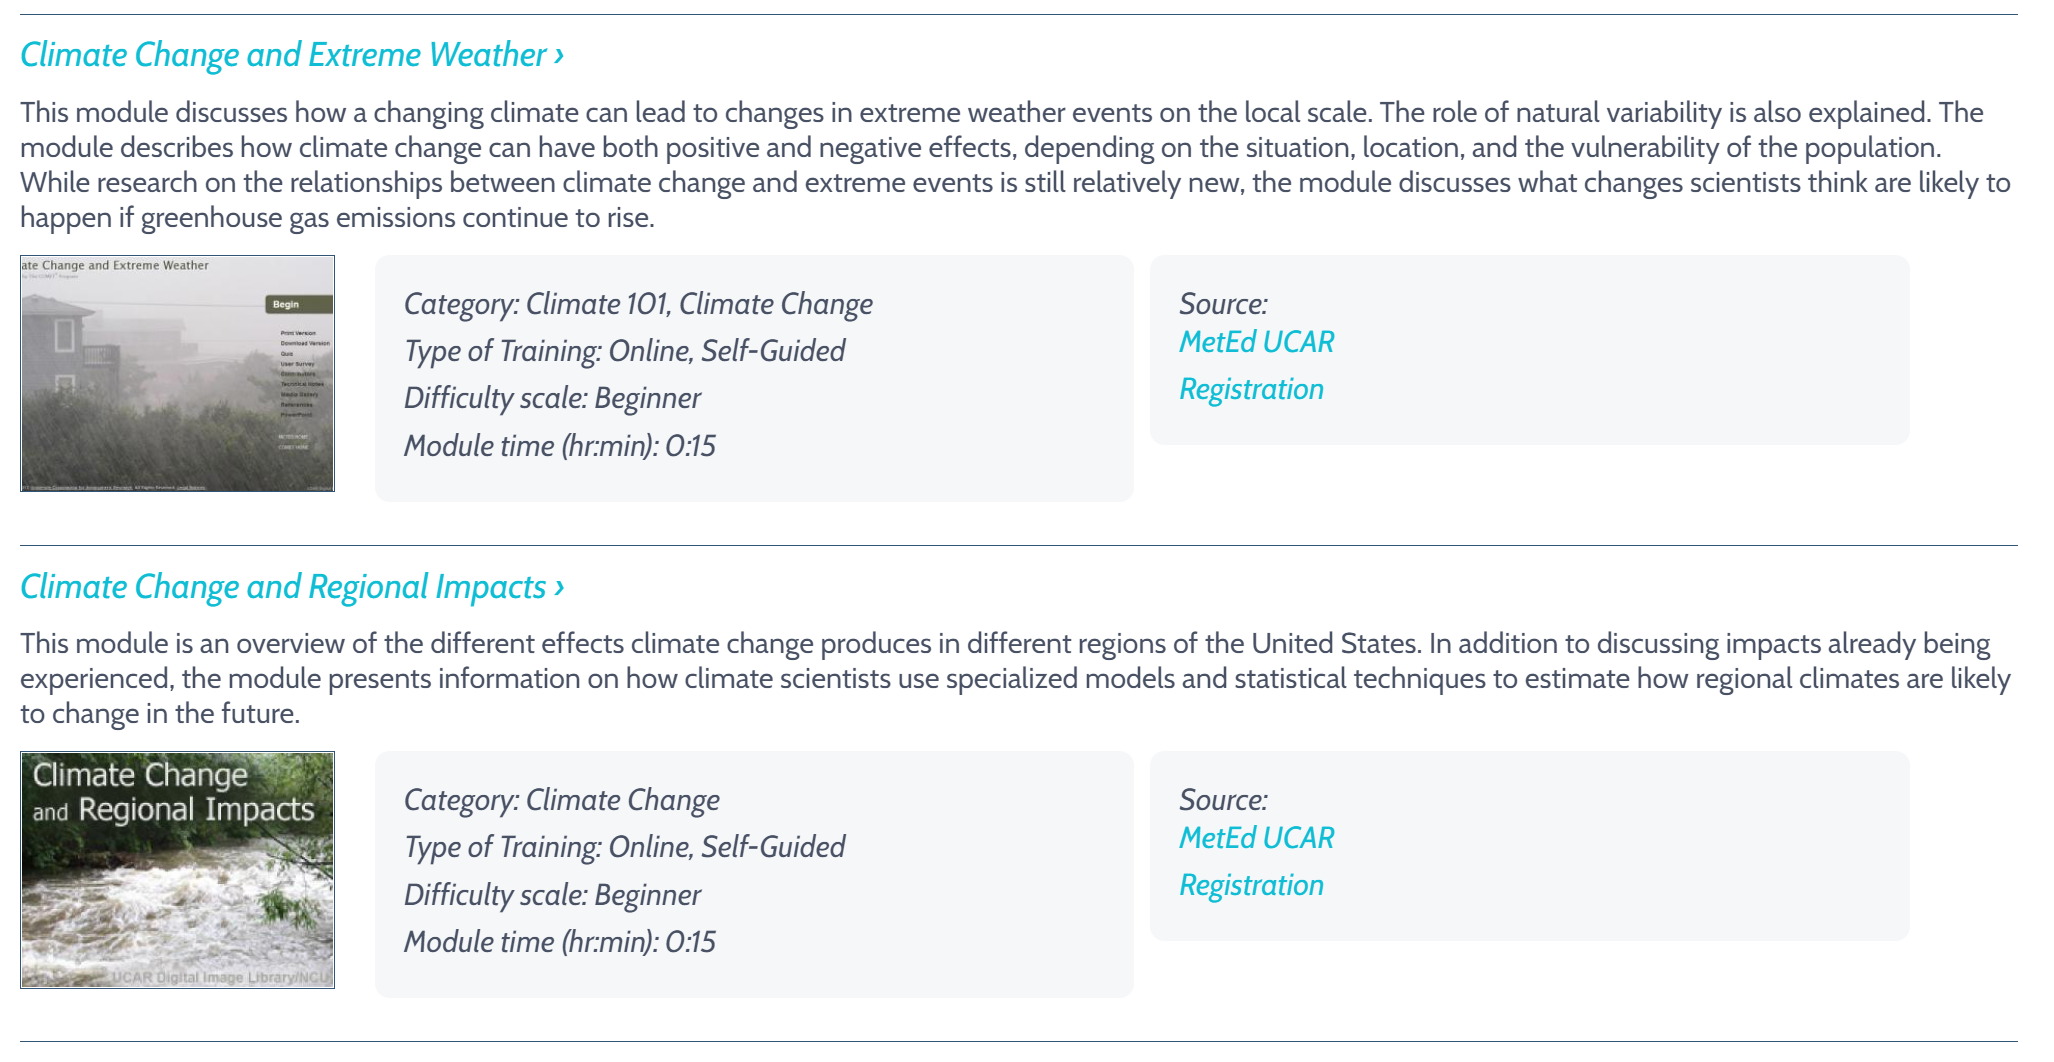
The image here is a screen shot of two of the shorter modules which are listed as 15 minutes, while others are longer. The modules are free, but you do have to register. These can be useful for classroom use or for educators to acquire some background knowledge.

What are the challenges to moving to clean energy?

Share of top three producing countries in extraction of selected minerals and fossil fuels, 2019.

The iea report The Role of Critical Minerals in Clean Energy Transitions (May 2021) notes:

Alongside a wealth of detail on mineral demand prospects under different technology and policy assumptions, it examines whether today’s mineral investments can meet the needs of a swiftly changing energy sector. It considers the task ahead to promote responsible and sustainable development of mineral resources, and offers vital insights for policy makers, including six key IEA recommendations for a new, comprehensive approach to mineral security.

The executive summary has 11 charts that are all interesting. I chose the one here as it point out potential geopolitical changes. Generally speaking, countries with fossil fuels don’t seem to be the ones with the minerals.

One of the challenges:

Our analysis of the near-term outlook for supply presents a mixed picture. Some minerals such as lithium raw material and cobalt are expected to be in surplus in the near term, while lithium chemical, battery-grade nickel and key rare earth elements (e.g. neodymium, dysprosium) might face tight supply in the years ahead. However, looking further ahead in a scenario consistent with climate goals, expected supply from existing mines and projects under construction is estimated to meet only half of projected lithium and cobalt requirements and 80% of copper needs by 2030.

A great report that can certainly be used as the basis for quantitative discussion related to clean energy. If you click on the charts you can then download the related data.

How hot was April 2021?

From NOAA’s Global Climate Report – April 2021:

The April 2021 global surface temperature was 0.79°C (1.42°F) above the 20th century average of 13.7°C (56.7°F). This was the smallest value for April since 2013 and was the ninth warmest April in the 142-year record. April 2021 marked the 45th consecutive April and the 436th consecutive month with temperatures, at least nominally, above the 20th-century average. December 1984 was the last time a monthly temperature was below average.

Time series data is available near the top of the page.

What’s new at the EPA?

After about a 4 year hiatus, the EPA’s page Climate Change Indicators in the United Stats has been updated with “Twelve new indicators and several years of data have been added to EPA’s indicator suite.” One new indicator is Permafrost:

The Deadhorse site in northern Alaska had the highest rate of temperature change, at +1.5°F per decade. The Livengood site in interior Alaska was the only site to get cooler over the period of record, though only slightly. Overall, permafrost temperatures have increased at an average rate of 0.6°F per decade.

There are csv files to download the data and background information about the indicators. This is an excellent resource page.

How big is the ideological divide in the U.S.?

Percent who say that speaking the country’s language is important to being part of (the country).

Pew answers the question in their article Ideological divisions over cultural issues are far wider in the U.S. than in the UK, France and Germany by Laura Silver (5/5/2021). In summary (bold added by me):

Across 11 questions on cultural subjects ranging from nationalism to political correctness, the gap between the ideological left and right in the United States – or liberals and conservatives, in the common U.S. parlance – is significantly wider than the ideological gaps found in the European countries surveyed. In some cases, this is because America’s conservatives are outliers. In other cases, it’s because America’s liberals are outliers. In still other cases, both the right and left in the U.S. hold more extreme positions than their European counterparts, resulting in ideological gaps that are more than twice the size of those seen in the UK, Germany or France.

There are a total of eight charts like the one here, plus links to the survey questions and methodology. So, how divided can a country be and still function?

Where are the 1991-2020 U.S. Climate Normals?

NOAA has this data on the 1991-2020 U.S. Climate Normals Quick Access page.

The 2020 U.S. Climate Normals Quick Access tool provides access to data from the most recent version of the U.S. Climate Normals. This iteration of the Normals product provides 30 year averages of temperature, precipitation, and other climate variables measured at more than 15,000 U.S observation stations from 1991–2020, as well as a set of 15 year supplemental normals for 2006–2020.

The image here is a screen shot of monthly normals for one of the Ithaca, NY locations. On the top right corner of the graph there is a link to download the data, which is also in a table below the graph.

Who voted in 2020?

The Census Bureau provides an overview of who voted in 2020 and how that has changed in their article Record High Turnout in the 2020 General Election by Jacob Fabina (4/29/2021).

Turnout rates in 2020 were higher than in the 2016 election for non-Hispanic White, non-Hispanic Black, non-Hispanic Asian, and Hispanic race and origin groups.

The largest increase was for non-Hispanic Asians (Figure 2). Of the non-Hispanic Asian population who were both citizens and of voting age, 59% reported voting in 2020, compared to 49% in 2016.

People with a bachelor’s degree or higher were 32% of the citizen voting-age population in 2016 and 35% in 2020. Their share of the voting population went from 40% to 41% during that time.

Three are a total of five figures and links to data.

What are the energy use and emissions projections for 2021?

The IEA Global Energy Review 2021 (April 2021) provides an outlook for 2021 energy use and emissions. Energy use to go up:

Global energy demand is set to increase by 4.6% in 2021, more than offsetting the 4% contraction in 2020 and pushing demand 0.5% above 2019 levels. Almost 70% of the projected increase in global energy demand is in emerging markets and developing economies, where demand is set to rise to 3.4% above 2019 levels. Energy use in advanced economies is on course to be 3% below pre-Covid levels.

CO2 to go up:

Demand for all fossil fuels is set to grow significantly in 2021. Coal demand alone is projected to increase by 60% more than all renewables combined, underpinning a rise in emissions of almost 5%, or 1 500 Mt. This expected increase would reverse 80% of the drop in 2020, with emissions ending up just 1.2% (or 400 Mt) below 2019 emissions levels.

Lots of graphs in this report. The data doesn’t seem to be available with the report but the IEA has a data page where you may be able to find data you’d like.

What is the trend in of COVID-19 deaths?

The media tends to focus on extremes and generally bad ones at that. If you focus on Michigan one would come to believe that things aren’t improving much with COVID-19. The graph here is from 91-DIVOC, which has a number of interactive graphs, along with making the data available. Over the last 12 weeks deaths are down about 1/5 and only one state is really going against the downward trend. The trend should continue downward as more folks are vaccinated, so please get vaccinated. Note: At this point we are passing half the U.S. adult population vaccinated.