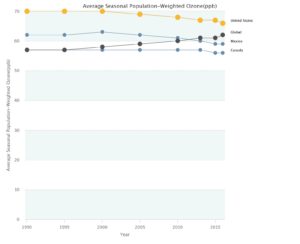
 The State of Global Air 2018 has an interactive air pollution graph to compare countries and regions. Graph and data are both available. For example, the graph here is Average Seasonal Population-Weighted Ozone (ppb) for Canada, Mexico, and the U.S. (in yellow), as well as the global average (in black). We can select ambient particulate matter pollution and household air pollution from solid fuels, along with most countries or regions. There is also a tab for health impact as the number of deaths (this is not a rate so larger countries will likely have more deaths) related to the particular air pollution for the selected country. The State of Global Air 2018 explains their methods, has a full report, and maps.