Tag Archives: people

What 5 states had the highest mortality rates?

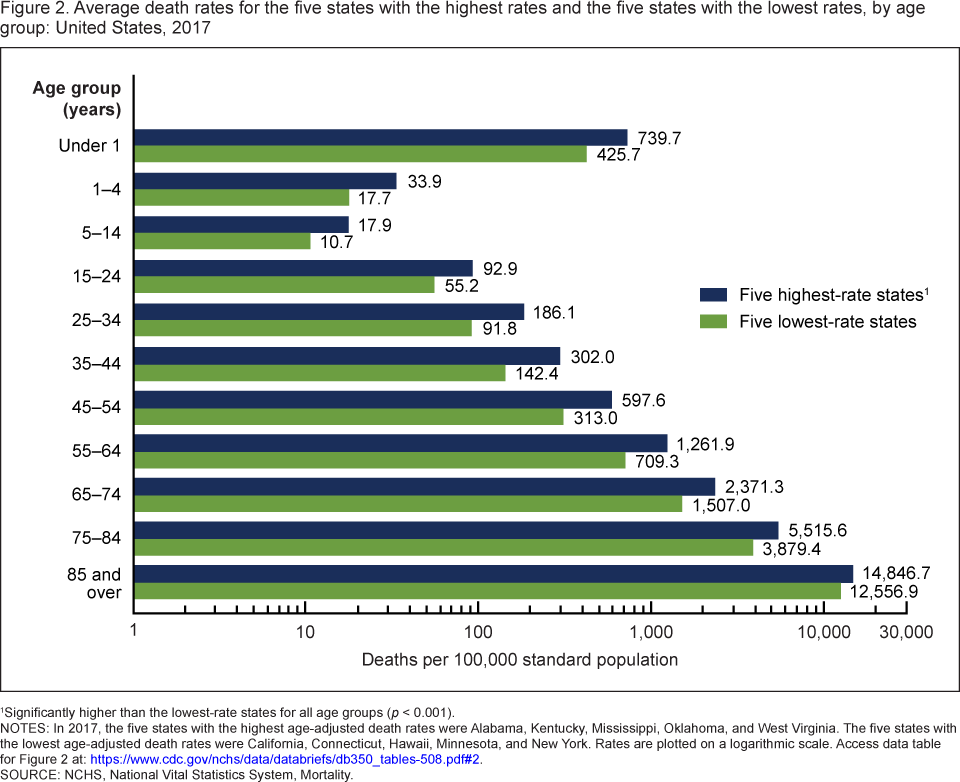
The CDC data brief, Mortality Patterns Between Five States with Highest Death Rates and Five States with Lowest Death Rates: United States, 2017 by Jiaquan Xu, M.D. (9/5/2019), provides the  graph here of death rates by age (pay attention to the log scale on the x-axis). The five states with the lowest age-adjusted death rates: California, Connecticut, Hawaii, Minnesota, and New York. The highest: Alabama, Kentucky, Mississippi, Oklahoma, and West Virginia.  By gender:

Among males, the average death rate for the states with the highest rates (1,094.3) was 48% higher than that for the states with the lowest rates (741.2).

Among females, the average death rate for the states with the highest rates (785.7) was 49% higher than that for the states with the lowest rates (526.4).

For Hispanics:

The rate for Hispanic persons was 27% lower (374.6 compared with 509.7) for the states with highest rates than for the states with the lowest rates.

There are four graph each with links to the data.
What is the distribution of people by age and race?

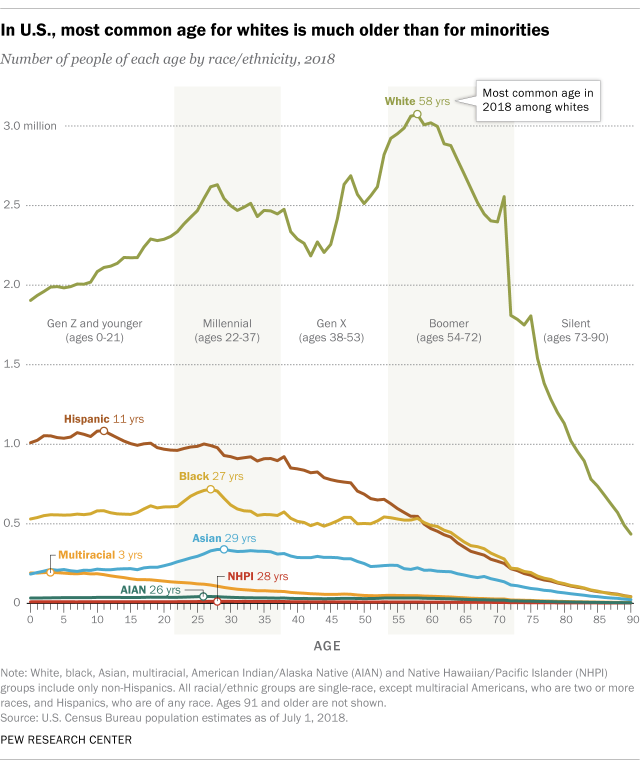
The Pew article, The most common age among whites in U.S. is 58, more than double that of racial and ethnic minorities by katherine Schaeffer (7/30/19) provides this graph of the distribution of age by race.

Whites had a median age of 44, meaning that if you lined up all whites in the U.S. from youngest to oldest, the person in the middle would be 44 years old. This compares with a median age of just 31 for minorities and 38 for the U.S. population overall.

U.S. Hispanics were also a notably youthful group, with a median age of 30. As a separate Pew Research Center report noted, Latinos have long been one of the nation’s youngest racial or ethnic groups, dating back to at least 1980.

The demographic differences leads to questions about studies that compare variables by race. If they don’t adjust for these differences they may be inaccurate. In general, a random sample of people will end up with an older cohort for whites and some variables are correlated with age.

How has growth is emigration by region changed?

The Pew Research Center article Latin America, Caribbean no longer world’s fastest growing source of international migrants by  Luis Noe-Bustamante and Mark Hugo Lopez (1/25/19) provides an overview emigration changes by region. The graph copied here shows how the growth in emigration from Latin America and the Caribbean has drooped from 58% from 1990-2000 to 7% for 2010-2017, which is slower than thew worldwide growth rate of 17%. On the other hand, 

Even though the percentage growth of the emigrant population from Latin American-Caribbean nations has slowed, the region is still a large source of emigrants. About 37 million people from the region lived outside their country of birth in 2017, up from 35 million in 2010 and accounting for nearly 15% of the world’s more than 250 million international migrants in 2017. The Asia-Pacific region is the source of the world’s largest emigrant population (85 million), as well as the largest share of the global total (33%).

The article includes three other charts, a table of data, and a methodology section with sources.

How much vacation time do workers get?

Statista put together a chart (copied here) of vacation time for 12 countries selected from OECD data  (see table PF2.3.A) of 42 countries in the post Vacation: Americans Get A Raw Deal by Niall McCarthy (8/8/18). Of the 42 countries listed the U.S. is the only one with a statutory minimum days of paid leave of 0. In fact, only 9 countries have a statutory minimum below 20 days.  The medium number of public holidays is 11, while the U.S. has 10. Four countries tie with the maximum of 15 public holidays.  The statista article notes:

The U.S. remains the only advanced economy that doesn’t guarantee paid vacation. Even though some companies are generous and provide their employees with up to 15 days of paid leave annually, almost one in four private sector workers does not receive any paid vacation, according to the Center for Economic and Policy Research.

How is climate change impacting Easter Island?

A New York Times article,  Easter Island Is Eroding, (3/15/18 by  Casey and Haner) has the answer.

Tourists usually begin their days in Tongariki, where they gather to watch the sunrise from behind a line of monoliths facing inland. Groups split off to Anakena, the island’s one sandy beach, or to the ancient platforms at Akahanga, a sprawling site of former villages on the shore where, tradition holds, the island’s mythical founder, Hotu Matu’a, is buried in a stone grave.

Yet all three sites now stand to be eroded by rising waters, scientists say.

“We don’t want people seeing these places through old photos,” Mr. Rapu said.

A beach is already lost:

The damage has been swift on Ovahe Beach, near where Mr. Huke came across bones in the sun. For generations, there had been a sandy beach here that was popular with tourists and locals. Nearby, a number of unmarked burial sites were covered with stones.

Now the waves have carried off almost all of the sand, leaving jagged volcanic stone. The burial sites have been damaged and it’s not clear how long they will survive the waves.

Walls collapsing:

At a site called Ura Uranga Te Mahina on the island’s southern coast, park officials were alarmed last year when blocks of a stone wall perched about 10 feet above a rocky coast collapsed after being battered by waves.

There is more and the article has fantastic photos.

People Impacted by Climate Change – The Nenets

The Nenets are reindeer herders in Russia’s Arctic that migrate 800 miles each year. The National Geographic Article, They Migrate 800 Miles a Year. Now It’s Getting Tougher, tells their story.

The Nenets have undertaken this annual migration for centuries, and at 800 miles round-trip, it’s one of the longest in the world. Yuri’s group, called Brigade 4, is a relic of a Soviet collective—under Soviet rule the Nenets endured decades of forced collectivization and religious persecution. They survived centuries of Russian rule before that. Through it all, they’ve managed to sustain their language, their animist worldview, and their nomadic traditions.

The Nenets are facing challenges.

As I talk to Yuri, the region is suffering another record-hot summer; the thermometer has already hit 94°F. It hasn’t rained for weeks, and it’s hard for reindeer to pull the loaded sleighs across the dry tundra. Before the summer is out, a boy and more than 2,300 reindeer will die from anthrax on southern Yamal, and dozens of people will get sick—a direct result of thawing permafrost, which allowed animal carcasses buried during an outbreak in the 1940s to reemerge, still bearing infectious microbes.

And it isn’t just climate related challenges.

Yet climate change isn’t even the greatest threat to the Nenets. Development is. Russia’s quest for new sources of hydrocarbons has encroached on pastures that were already tight for the estimated 255,000 reindeer and the 6,000 nomadic herders that live on Yamal.

Read the article, which includes a video and a number of great photos and maps: They Migrate 800 Miles a Year. Now It’s Getting Tougher.

Related permafrost articles from this blog: Climate Change, Melting Permafrost, and Disease, Melting Permafrost and a Feedback Loop, Climate Change – Impacts on People, and Methane Bubbles – A Feedback Loop.

The Human Impact of Climate Change – The Guna People

This blog focuses on data, but we pause periodically to put the data into perspective. When educating about sustainability we want stories along with the data. The BBC provides such a story: The island people with a climate change escape plan.  The Guna people live on small islands off Panama.

Most Guna communities live on the archipelago, and have done for centuries, after they were driven offshore by disease and venomous snakes. But now many believe that only a move back to the mainland can secure their future.

They have a plan, but completing the plan isn’t simple.

However, today work on the school and hospital has halted, as a result of a litany of contractual hiccups – and crucially, a failure to plan for adequate supplies of water and electricity. Work never began on the 300 houses.

Along with rising water there are other environmental issues.

“Coral reefs stop wave action. So when you remove the coral, even down to 3m in depth, you have no protection. This has created chaos for people,” says Dr Hector Guzman, a research scientist at the Smithsonian Tropical Institute in Panama City.

This is an excellent story with great photos. Take the time to read it.

Climate Change – Impacts on People

Kivalina, an Alaskan village facing coastal erosion. Credit: ShoreZone/flickr

This blog looks to post materials that contain data in some form that can be used in classrooms whenever possible. But, we need to also recognize that climate change is already impacting people.  Climate Central’s post, Alaska Towns At Risk from Rising Seas Sound Alarm, provides us with this context.

According to the Army Corps of Engineers, 31 Alaskan communities face “imminent” existential threats from coastline erosion, flooding and other consequences of temperatures that are rising twice as quickly in the state as the global average. A handful — Kivalina, Newtok, Shishmaref and Shaktoolik — are considered in particularly perilous positions and will need to be moved.

Some of the reasons these towns need to be moved:

As the coastal buffer of sea ice retreats, towns are more vulnerable to storms and coastline erosion. Many key structures are built on permafrost, which is also melting, causing the buildings to subside or even crumple completely. And a succession of mild years — 2016 was nearly 6F warmer than the long-term average — is disrupting the patterns of wildlife in an environment where people rely upon the animals they catch for sustenance.

Climate Central’s post is worth reading. Recall our post that melting permafrost is part of a feedback loop.