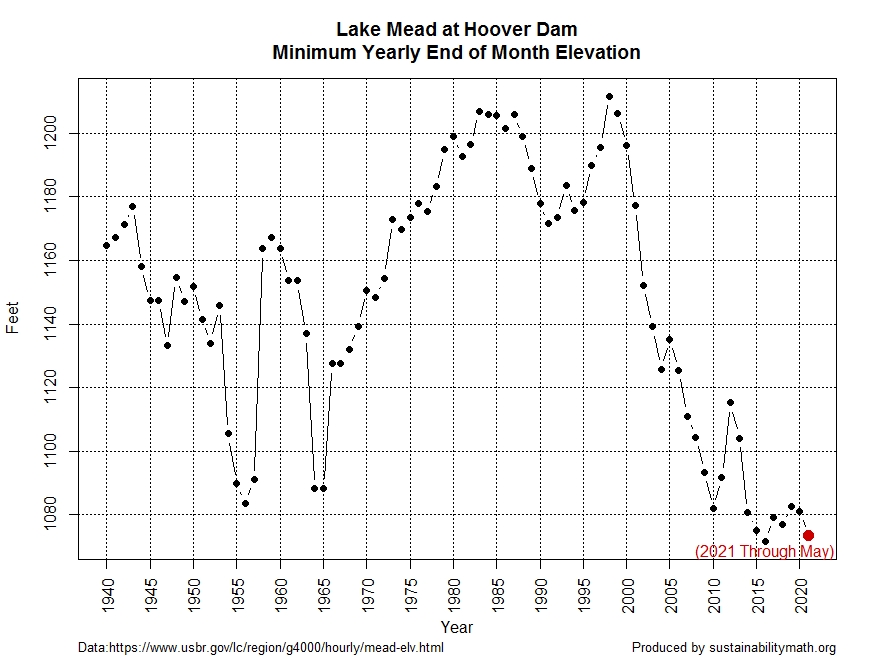
The Bureau of Reclamation posts the end of month elevation for Lake Mead dating back to 1935. I created the graph of minimum yearly end of month elevation starting in 1940 since Hoover Dam was only created in 1935. Here is the R code to create the graph including importing the data directly from the webpage. I’ll leave it as a project to normalize this based on the number of people the reservoir serves.