What’s new at sustainabilitymath?

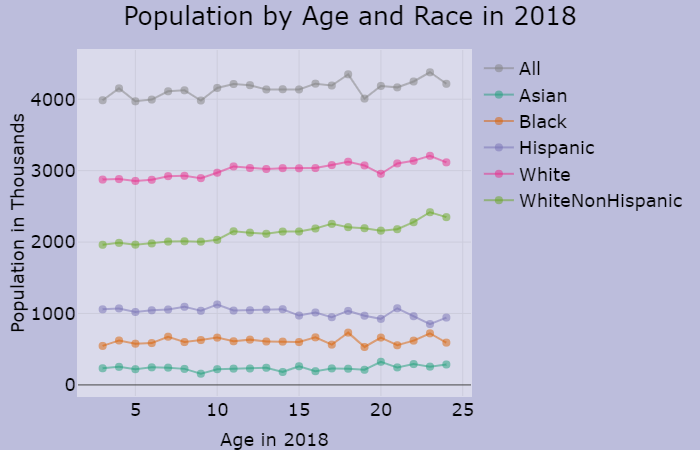
A new interactive graph was posted which gives population by age and race as of October 2018. The data is from the Census Bureau page School Enrollment in the United States: October 2018 – Detailed Tables and collected from the excel files in Table 2. The hover information will provide the percent of the total as well as percent male and female of the group. Go to the Interactive Graph page and take a look.

About Thomas J. Pfaff

Thomas J. Pfaff is a Professor of Mathematics at Ithaca College. He created this website because he believes that sustainability, ranging from climate change to social justice, should be included in all courses whenever possible.

Check Also

What is the male vs female grip strength difference?

Grip strength is one of the factors measured in theĀ National Health and Nutrition Examination Survey …