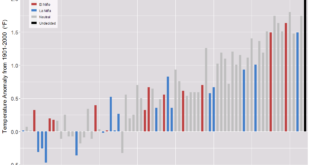
The data sets for the calculus and statistics projects have all been updated. Along with the traditional Excel file each tile now has a csv file with the data used to create the graphs. The associated R file now pulls the data directly from the csv file. Of course you can use other programs and import the data directly.
The graph here is from the Ozone Hole project on the Calculus page. This provides an example that when the world cooperates things can improve.

