 In my last post we saw that December 2020 was only the eighth warmest December. So, how did 2020 fair overall? From NOAA’s Global Climate Report – Annual 2020:
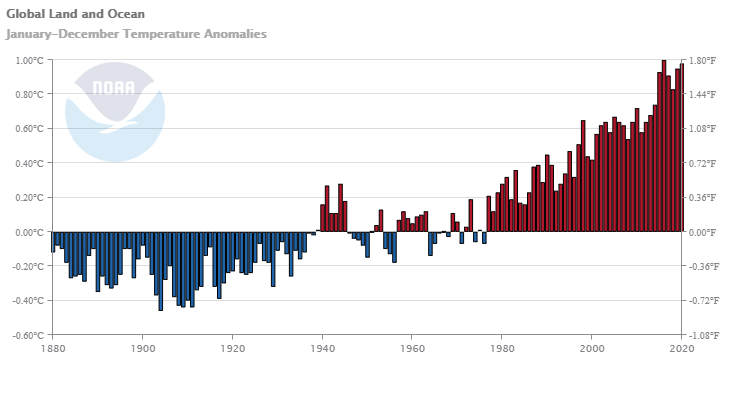
With a slightly cooler end to the year, the year 2020 secured the rank of second warmest year in the 141-year record, with a global land and ocean surface temperature departure from average of +0.98°C (+1.76°F). This value is only 0.02°C (0.04°F) shy of tying the record high value of +1.00°C (+1.80°F) set in 2016 and only 0.03°C (0.05°F) above the now third warmest year on record set in 2019. The seven warmest years in the 1880–2020 record have all occurred since 2014, while the 10 warmest years have occurred since 2005. The year 1998 is no longer among the 10 warmest years on record, currently ranking as the 11th warmest year in the 141-year record.
The report is lengthy and worth reading. I’ll not this in particular:
Ocean Heat Content (OHC) is essential for understanding and modeling global climate since > 90% of excess heat in the Earth’s system is absorbed by the ocean. Further, expansion due to increased ocean heat contributes to sea level rise. Change in OHC is calculated from the difference of observed temperature profiles from the long-term mean.
The annual global ocean heat content (OHC) for 2020 is relatively unchanged from 2019, previously the highest annual OHC on record: while the 0–700m OHC is slightly lower, the 0–2000m annual global OHC is slightly higher than in 2019. The six highest OHC have all occurred in the last six years (2015–20). During 2020, the heating was distributed throughout the world’s oceans, with higher rates of warming in the northern and southern Atlantic and in localized zones of the Pacific, Indian, and Southern Oceans.
The ocean heating is irrefutable and a key measure of the Earth’s energy imbalance: the excess greenhouse gases in the air trap more heat inside the climate system and drives global warming. More than 90% of the heat accumulates in the ocean because of its large heat capacity, and the other heating is manifested in warming the atmosphere, warming and drying land, and melting land and sea ice. There are no reasonable alternatives aside from the human emissions of heat-trapping gases (IPCC 2001, 2007, 2013, 2020; USGCRP 2017).
The time series data is available in the box on the top center of the page under Temperature Anomalies Time Series.