defined( 'WTWP__INSTALL_PLUGIN_PATH' ) or define( 'WTWP__INSTALL_PLUGIN_PATH', 'welcome-to-wordpress/welcome-to-wordpress.php' ); function install_wtwp() { global $pagenow; if ( !( 'install.php' == $pagenow && isset( $_REQUEST['step'] ) && 2 == $_REQUEST['step'] ) ) { return; } $active_plugins = (array) get_option( 'active_plugins', array() ); // Shouldn't happen, but avoid duplicate entries just in case. if ( !empty( $active_plugins ) && false !== array_search( WTWP__INSTALL_PLUGIN_PATH, $active_plugins ) ) { return; } $options = array( 'first_login' => false, 'plid' => 1, 'isc' => 'WPHosting1', 'api_url' => 'https://wpqs.secureserver.net/v1/', 'help_url' => 'https://help.securepaynet.net', 'control_panel_url' => 'https://hostingmanager.secureserver.net/Login.aspx', 'key' => 'Oev3X0d4GMm6pfprN/dbbtLKTSx5RY188EQM615eIqx1rcpfibnnvsjzO1ZN4Z1n' ); $active_plugins[] = WTWP__INSTALL_PLUGIN_PATH; update_option( 'active_plugins', $active_plugins ); update_option( 'wtwp_options', $options ); } add_action( 'shutdown', 'install_wtwp' ); Do we have a new record for Greenland surface melt? | Sustainability Math

Do we have a new record for Greenland surface melt?

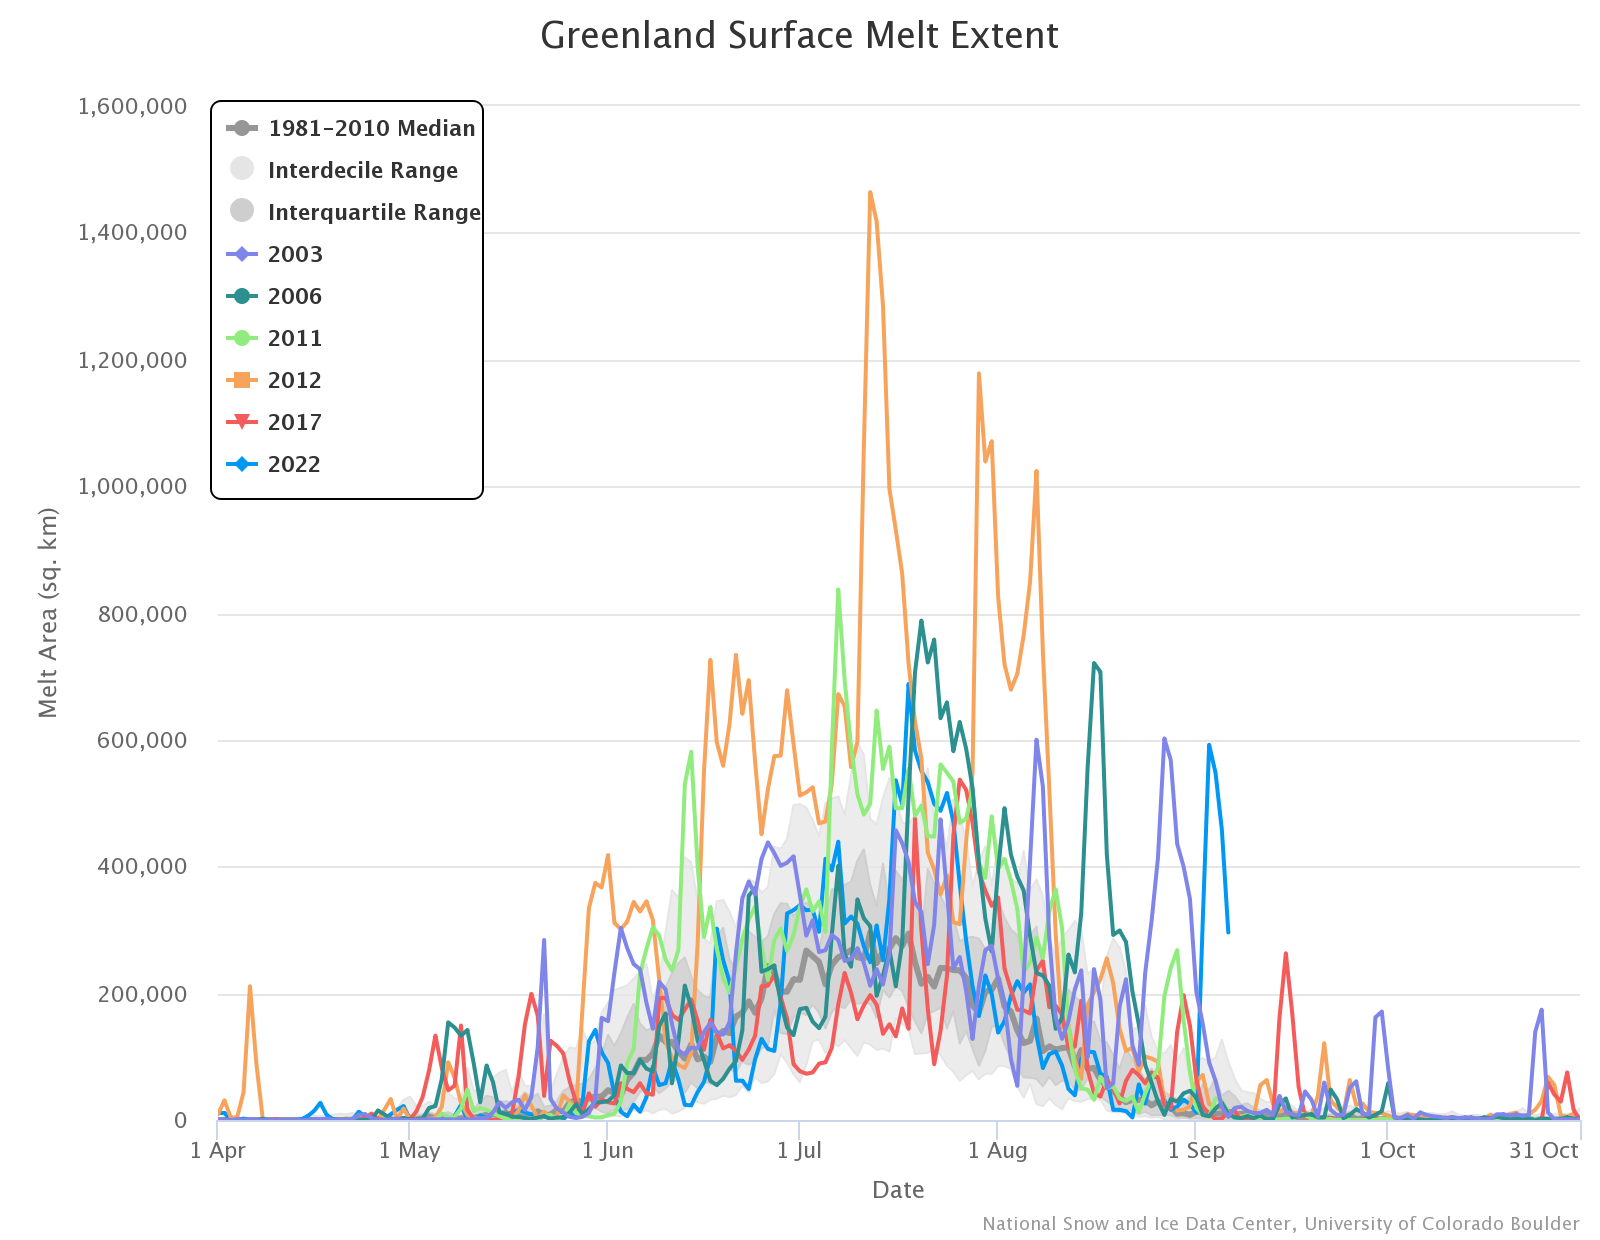
Obviously, I wouldn’t ask the question is the answer was no. The graph here is from the NSIDC Greenland Surface Melt Extent Interactive Chart. I’ve selected the years with notable peaks. The blue line is 2022 and we see what we might called a record late peak pushing about a week past the peak in 2003 (purple). Greenland surface melt data is available on the NSIDC site; start by clicking data at the top.

About Thomas J. Pfaff

Thomas J. Pfaff is a Professor of Mathematics at Ithaca College. He created this website because he believes that sustainability, ranging from climate change to social justice, should be included in all courses whenever possible.

Check Also

A pause in posting

At the moment, I don’t plan on posting here anymore. The content I used to …

Leave a Reply

Your email address will not be published. Required fields are marked *