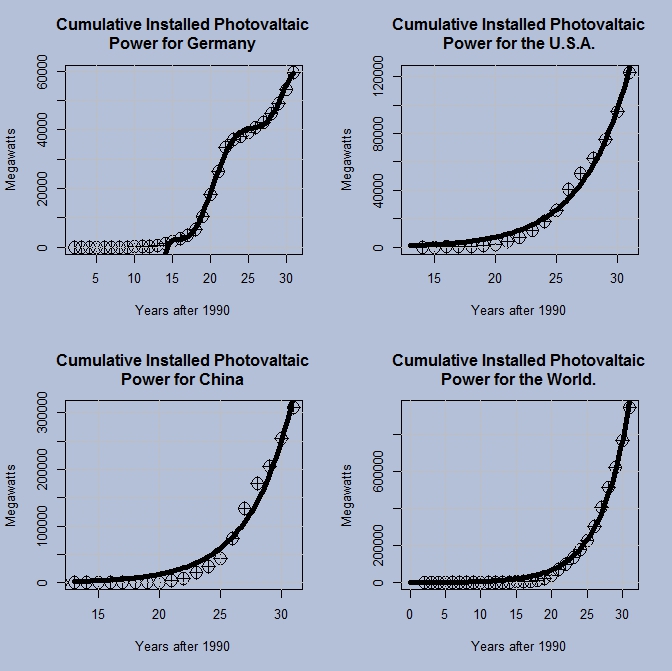
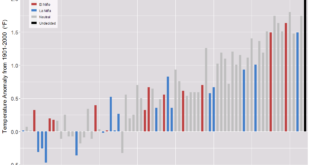
The calculus projects page has been updated with the most recent data available. Most of the trends didn’t change but solar did and hence there were some changes in the countries used in the graphs. There is also an updated Excel curve fitting directions for those using Excel (consider using R). As before there are csv files that can be accessed directly through R, included in each tile, or other software. If you have any thought about the page then let me know. Up next is the statistics projects page.
Note my resume if you are in need of some freelance data support or any other project that you think my skills would fit.

