 The links to resources page has been revamped. For those of you looking for data I think I have made it easier. There is now a box with the type of data in bold and a link. I’ve also added a spatial data box for those looking for data with lat and lon or some other spatial attribute. My goal is to add to both of these boxes over the next year.
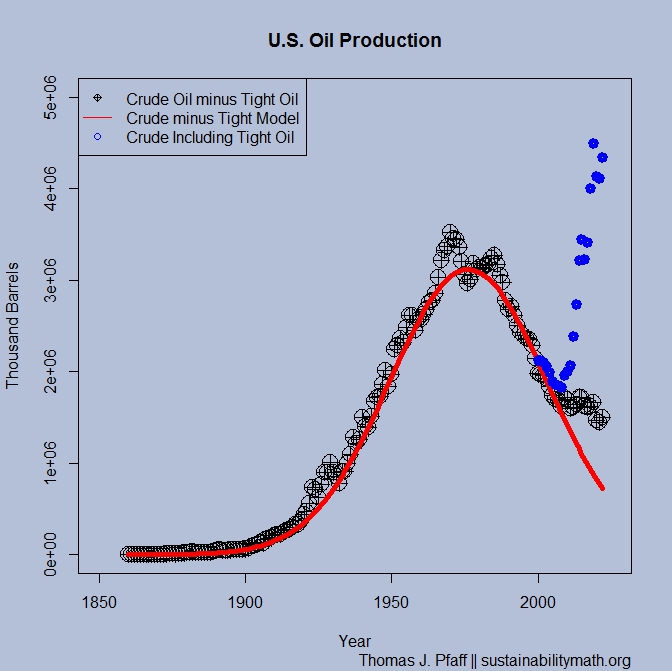
All of the statistics projects have also been updated. The graph here is for the U.S. Oil Production project. The black dots, conventional crude oil, are still roughly fitting a normal curve. All of the increase in U.S. oil production is from tight or shale oil. Worth noting.
Feel free to email me and let me know if any of this (regular posts, projects, other) is useful and suggestions for improvement are welcome: thomas.pfaff@sustainabilitymath.org.