At the moment, I don’t plan on posting here anymore. The content I used to post here and more can be found at https://briefedbydata.substack.com/ Over the next year, my plan is to shut this site down and move relevant material to Briefed by Data. Please subscribe to the newsletter there …
Read More »How hot was August 2024?
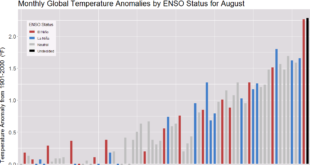
This first appeared on my QTRS Sept 19, 2024 post at Briefed by Data. If you like data and graphs and are really curious, you should subscribe (for free) to Briefed by Data. Here is your monthly global temperature anomaly update. A bit of a surprise that Aug 2024 was …
Read More »How hot was June 2024?

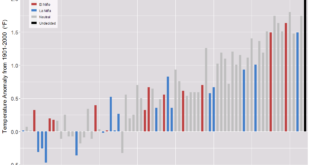
Note: This first appeared on my Briefed by Data site. Here is my monthly update of temperature anomalies. As you’ll see, June 2024 did set a record, but when you look at the all-months graph, the last black bar is no higher than some past neutral ENSO months. Here is …
Read More »How hot was May 2024?
Note: Please be aware that I mostly post on my Briefed by Data substack. If you like sustainaiblitymath then you may very well like Briefed by Data. For example, this graph and one with all months can be found in this post. Please check it out. As you can …
Read More »How hot was April 2024?
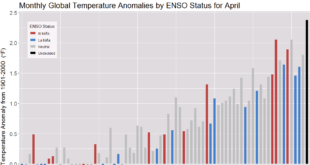
With El Niño still hanging around April set a record, but it is in the pattern we would expect. A record, but not surprising. With El Niño still hanging around April set a record, but it is in the pattern we would expect. A record, but not surprising. Here is …
Read More »How hot was March 2024?
According to NOAA March 2024 was the warmest March on record for the globe in NOAA’s 175-year record. The March global surface temperature was 1.35°C (2.43°F) above the 20th-century average of 12.7°C (54.9°F). This is 0.01°C ( °F) warmer than the previous March record set in 2016, and the tenth consecutive …
Read More »How hot was February 2024?
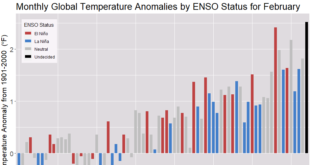
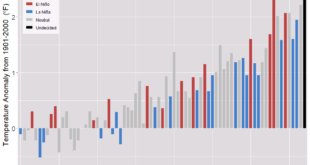
Here is the February anomaly showing that 2024 was barely a record anomaly for February, which is not surprising given it is expected to be an El Niño month. Overall, it was still one of the top anomaly months. You’ll find this graph, the full anomaly graph of all months, …
Read More »Is the world using less fossil fuels?
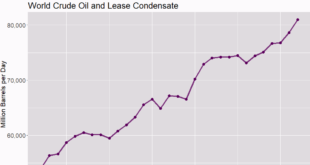
Nope. Wind and solar energy have increased, but so have coal, natural gas, and oil. In fact, if we look at the trends for fossil fuel use, it isn’t clear that wind and solar have any impact. I provide graphs for all five energy sources—the one here is for oil—in …
Read More »How hot was January 2024?
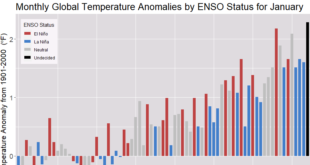
January did set a new record for temperature, but only by a small amount. The El Niño event seems to be slowing. You’ll find the all-month graph of temperature anomalies and more in the February 21 Quick Takes and Random Stuff post on Briefed by Data.
Read More »Where can you find applied math for the classroom?
On my Briefed by Data site, I’ve started doing a monthly post called Classroom Connections. The idea is to list a number of articles where the math could possibly be used in the classroom. The level ranges from engaging graphs and basic math to modeling and data science. For example …
Read More »