This is not my usual post but since most of you reading this are in some math area I just had to share this. I’ll be more serious on Thursday.
How deep are the oceans?
https://www.youtube.com/watch?v=Q5C7sqVe2Vg
It is often difficult to comprehend quantitative differences. MetaBallStudios‘ YouTube channel has a collection of comparison videos, such as the depth of oceans, to aid in understanding differences. There are a number of great videos that could be useful in a quantitative literacy based class. Take a look as they are really cool.
Were can we find climate related training courses?
 Climate.gov has a training courses page. If you filter by type of training you’ll see there are 35 online self-guided courses.
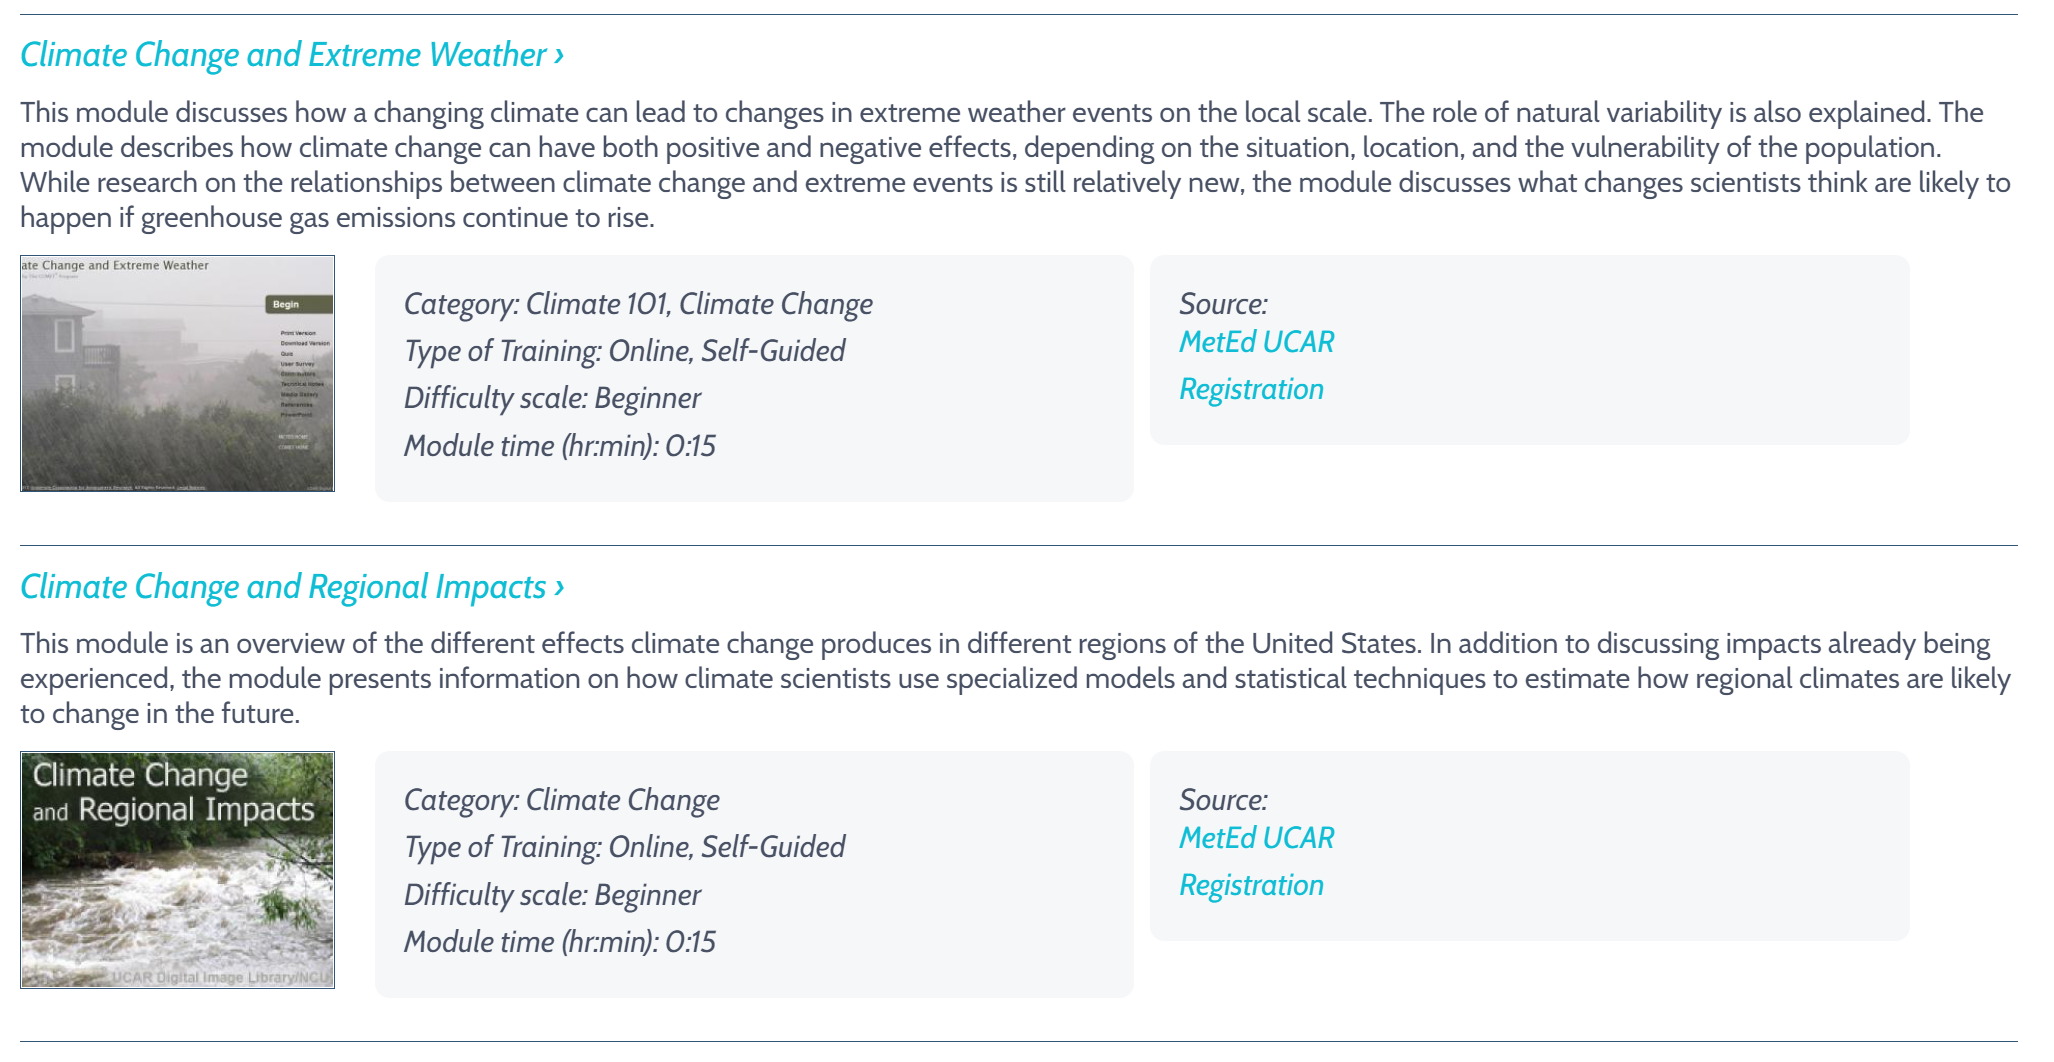
The training courses here can help you acquire the tools, skills, and knowledge you need to manage your climate-related risks and opportunities. All courses are free of charge, and are offered in at least one of three formats: online audio-visual presentations (“Online, Self-Guided” and “Tool Tutorial”), training webinars (“Online, Scheduled Lecture Series”), and residence training courses (“Onsite, Instructor-Led”). Each training module is accompanied with a test to help you evaluate your knowledge. These courses feature scientific information adapted from authoritative sources, prepared by recognized subject matter experts. The courses have been pilot tested with users and other subject matter experts and may be updated periodically, as needed.
The image here is a screen shot of two of the shorter modules which are listed as 15 minutes, while others are longer. The modules are free, but you do have to register. These can be useful for classroom use or for educators to acquire some background knowledge.
Is there a place to go to help understand climate?
 Climate.gov has the page Understanding Climate where they post all of their articles related to climate change. You’ll find information, explanations, graphs, and sources for data related to understanding climate. For example, the April 19, 2021 article Climate change and the 1991-2020 U.S. Climate Normals has the graph copied here. This is a perfect first place to look for educational materials related to climate change, along with graphs and quantitative information for statistics and QL courses.
Happy Earth Day!
Looking for Climate Curriculum Materials?
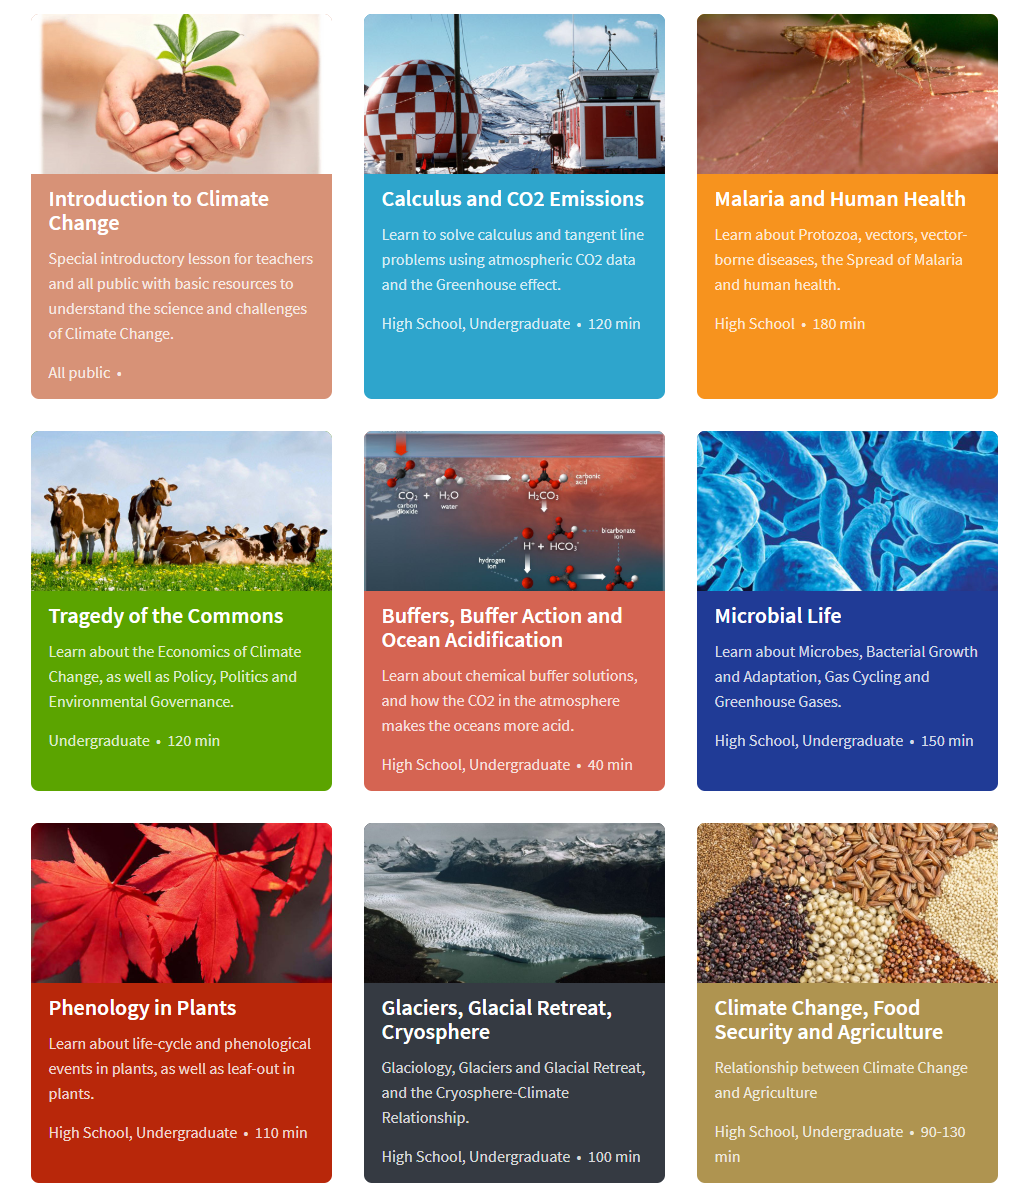
If you are looking for teaching tools or lessons plans related to climate change then check out TROP ICSU.
The TROP ICSU project collects and curates educational resources for teachers and self-learners to learn about Climate Change. The quality of life of future generations is largely dependent on the quality of education that we impart to today’s students.
The goal is not to introduce Climate Education as a stand-alone topic, but to integrate it with the core curriculum of Science, Mathematics, and Social Sciences.
The photo here is a snapshot of their lesson plans page.
What is the status of the ozone hole?
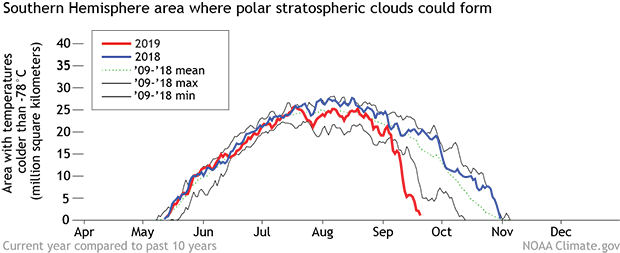
According to the NOAA article Five questions about 2019’s record-small ozone hole by Rebecca Lindsey (10/21/2019):
In 2019, the hole that developed in the ozone layer over Antarctica was the smallest on record since 1982, according to the NASA/NOAA press release. In an average spring, the hole expands throughout September and early October to a maximum extent of about 8 million square miles (21 million square kilometers), an area larger than the United States and Canada combined. In 2019, the hole reached 6.3 million square miles (16.4 million square kilometers) on September 8, but then shrank to less than 3.9 million square miles (10 million square kilometers) for the remainder of September and the first half of October.
Why so small?
An uncommon weather event—a sudden stratospheric warming—disrupted the circulation in the polar stratosphere in early September, just as the ozone hole was beginning to form.
What about the future?
No, this year’s small ozone hole was simply the result of an isolated weather event, not part of a trend. Thanks to the international treaty banning the production and use of CFCs (short for chlorofluorocarbons), levels of these compounds have been declining since about 2000. But because CFCs are so long-lived, concentrations remain high enough to cause significant ozone loss each spring. With continued declines in CFCs, experts project the ozone layer will recover to its 1980 conditions around 2070.
There are three other graphics and the article is worth reading. If you are looking for classroom materials related to the ozone hole consider the Near-Ground Level Ozone Pollution Lab posted by NOAA and designed by SERC. Also note the Ozone project in the Calculus Projects page.
Does NOAA have resources for teachers?
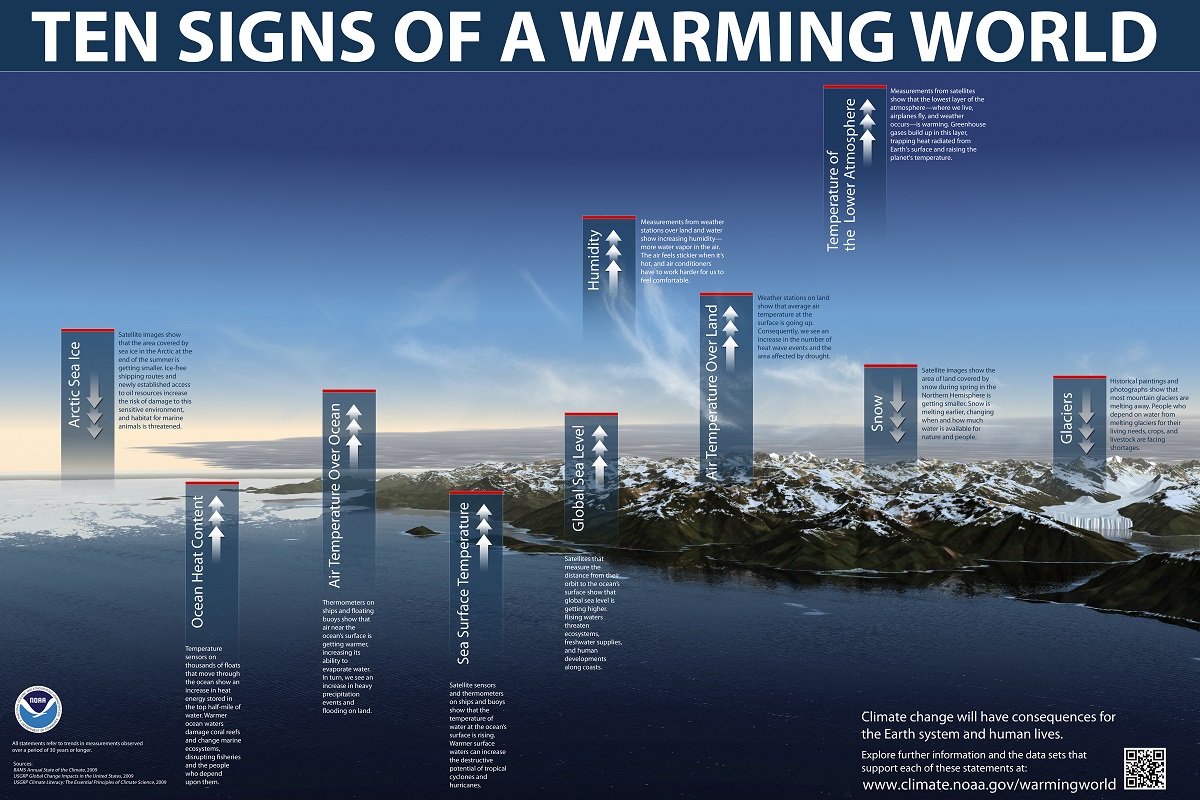 NOAA provides numerous resources for teachers including data sources, classroom materials, citizen scientists opportunities, and free posters (like the one copied here). A starting point to find these resources is the post Teachers: Get ready for the new school year with NOAA (8/5/19).
What is earth overshoot day?
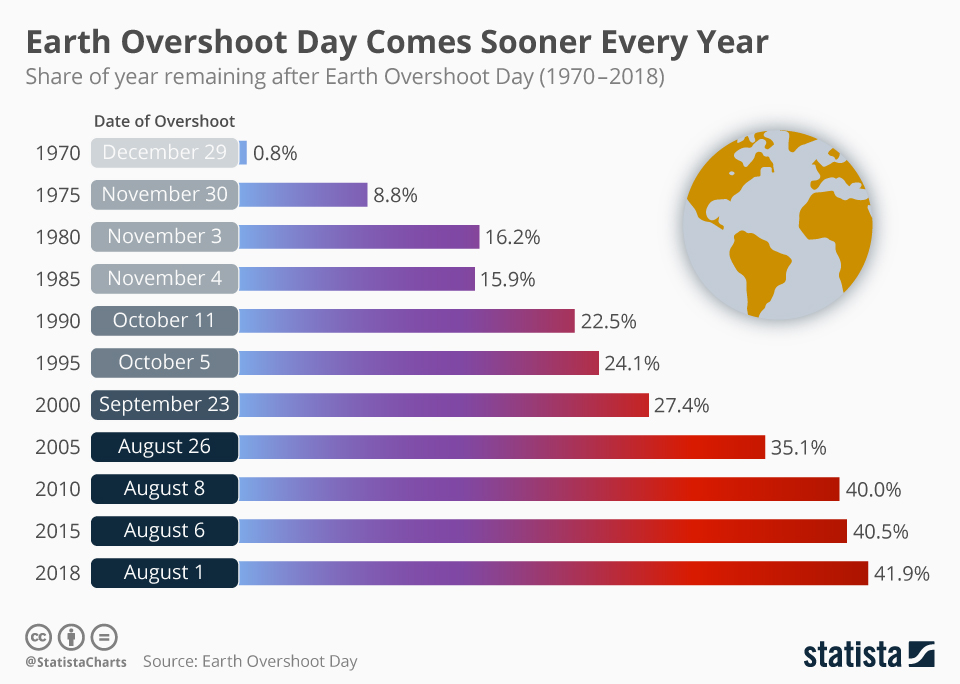
According to Earth Overshoot Day:
Earth Overshoot Day marks the date when humanity’s demand for ecological resources and services in a given year exceeds what Earth can regenerate in that year. We maintain this deficit by liquidating stocks of ecological resources and accumulating waste, primarily carbon dioxide in the atmosphere.
The graph here is from statista and is from data posted by Earth Overshoot Day. The Earth Overshoot website has useful materials for teachers.
How many ways does NASA use pi?
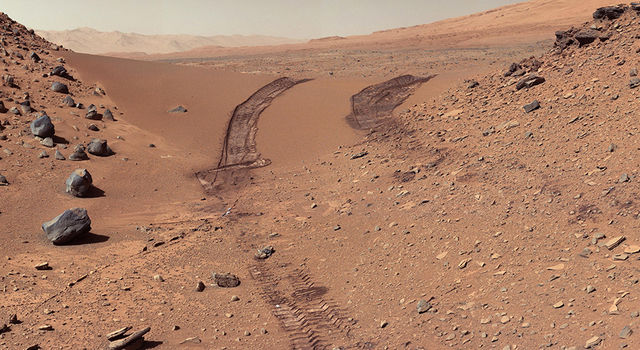 At least 18 according to the Jet Propulsion Laboratory at NASA based on the article for pi day — Oh, the Places We Go: 18 Ways NASA Uses Pi. Number 12 on the list: Keeping rover wheels turning:
Rover wheels have distinct designs on them that leave patterns on the ground as they turn. These patterns serve as visual markers that help operators while driving the Mars rovers remotely from Earth. Pi is used to calculate how far the rover should travel with each wheel rotation. By measuring the distance from one wheel mark to another, rover drivers can determine if the wheels are slipping or if they’ve driven the expected distance.
Each of the 18 on the list has an associated project with a printable poster. The Celebrate Pi Day with NASA page has resources for educators, students, and pi day enthusiasts.
Where can we find basic climate information?
 The answer is Climate Kids by NASA. Climate kids is aimed at, well, kids, but it serves as a fantastic primer of basic climate science. For example, under Big Questions and then How do we know the climate is changing? we find short explanations of the following questions (with links to further resources): So what if Earth gets a tiny bit warmer? Why is Earth getting warmer? (includes the CO2 graph copied here) How do we know what Earth was like long ago? How can so little warming cause so much melting? Doesn’t rising sea level just bring us closer to the beach? How does climate change affect other species?
The main menu of pages has Big Question. Weather and Climate. Atmosphere. Water. Energy. Plants & Animals. No matter how much you know about climate change, you’ll find something interesting on Climate Kids. You can also do a quick check of what you know with their Climate Trivia game.