Tag Archives: feedback loop

How much has spring snow cover changed?

This graph shows average area covered by snow in the Northern Hemisphere during March and April as the difference from the 1981-2010 average.

The Climate.gov article Climate Change: Spring Snow Cover by LuAnn Dahlman and Rebecca Lindsey (2/14/2020) provides the answer as seen in their graph here.

This change is another example of a feedback loop.

About one-third of Earth’s land surface is covered by snow for some part of the year. The bright white covering affects global conditions by reflecting solar energy away from surfaces that would otherwise absorb it. Therefore, the earlier decrease in snow cover increases the amount of sunlight absorbed by Earth, and in turn, surface temperatures.

The article includes the data for the graph shown here.

How much is permafrost warming?

From Permafrost is warming at a global scale, Biskaborn et. el. in Nature Communications.

The Inside Climate news article Permafrost is Warming Around the World, Study Shows – That’s a Problem for Climate Change by Bob Berwyn (1/16/19) reports on the Nature Communications paper Permafrost is warming at a global scale by Boris K. Biskaborn et. el. (1/16/19). From the article:

Detailed data from a global network of permafrost test sites show that, on average, permafrost regions around the world—in the Arctic, Antarctic and the high mountains—warmed by a half degree Fahrenheit between 2007 and 2016.

The most dramatic warming was found in the Siberian Arctic, where temperatures in the deep permafrost increased by 1.6 degrees Fahrenheit.

Why does this matter? It creates a feedback loop:

By some estimates, the Arctic permafrost contains enough carbon to nearly double the amount of CO2 currently in the Earth’s atmosphere. A rapid meltdown would be disastrous because it could release a lot of CO2—in addition to methane, a powerful short-lived climate pollutant—to the atmosphere, where it would cause additional warming, said Ted Schuur, a permafrost expert at Northern Arizona University.

There are more graphs in the paper and a link to the data. The Guardian has a recent related article Scientists shocked by Arctic permafrost thawing 70 years sooner than predicted (6/18/19)

Related posts:
Melting Permafrost and a Feedback Loop
Methane Bubbles – A Feedback Loop
How are beavers creating a climate feedback loop?

How important are clouds to our climate?

Lucy Reading-Ikkanda/Quanta Magazine


The Quanta Magazine article, A World Without Clouds A state-of-the-art supercomputer simulation indicates that a feedback loop between global warming and cloud loss can push Earth’s climate past a disastrous tipping point in as little as a century by Natalie Wolchover (2/25/19), reports on recent finding published in Nature Geoscience.

Clouds currently cover about two-thirds of the planet at any moment. But computer simulations of clouds have begun to suggest that as the Earth warms, clouds become scarcer. With fewer white surfaces reflecting sunlight back to space, the Earth gets even warmer, leading to more cloud loss. This feedback loop causes warming to spiral out of control.

The simulation revealed a tipping point: a level of warming at which stratocumulus clouds break up altogether. The disappearance occurs when the concentration of CO2 in the simulated atmosphere reaches 1,200 parts per million — a level that fossil fuel burning could push us past in about a century, under “business-as-usual” emissions scenarios. In the simulation, when the tipping point is breached, Earth’s temperature soars 8 degrees Celsius, in addition to the 4 degrees of warming or more caused by the CO2 directly.

There is evidence that this may have happened in the past:

More data points surfaced in China, then Europe, then all over. A picture emerged of a brief, cataclysmic hot spell 56 million years ago, now known as the Paleocene-Eocene Thermal Maximum (PETM). After heat-trapping carbon leaked into the sky from an unknown source, the planet, which was already several degrees Celsius hotter than it is today, gained an additional 6 degrees.

Related posts on feedback loops:
How are beavers creating a climate feedback loop?
Greenland Ice, Changing Albedo, and a Feedback Loop
Oceans as a Heat Sink: Possible Feedback Loop
A Feedback Loop: The Alaska Tundra
Methane Bubbles – A Feedback Loop

Follow Up: How old is Arctic Ice?

In a follow up to our May 28, 2018 post, How old is Arctic Ice?, the Washington Post has an article, The Arctic Ocean has lost 95 percent of its oldest ice — a startling sign of what’s to come by  Chris Mooney (12/11/18). It notes:

In 1985, the new NOAA report found, 16 percent of the Arctic was covered by the very oldest ice, more than four years old, at the height of winter. But by March, that number had dropped to under 1 percent. That’s a 95 percent decline.

At the same time, the youngest, first-year ice has gone from 55 percent of the pack in the 1980s to 77 percent, the report finds. (The remainder is ice that is two to three years old.)

The loss of sea ice creates a feedback loop:

There is a well-known feedback loop in the Arctic, caused by the reflectivity of ice and the darkness of the ocean. When the Arctic Ocean is covered by lighter, white ice, it reflects more sunlight back to space. But when there is less ice, more heat gets absorbed by the darker ocean — warming the planet further. That warmer ocean then inhibits the growth of future ice, which is why the process feeds upon itself.

and

Because of this, Arctic sea ice loss has already increased the warming of the planet as a whole. Ramanathan said the impact is equivalent to the warming effect of 250 billion tons of carbon dioxide emissions, or about six years of global emissions.

Ramanathan fears that entirely ice-free summers, if they began to occur regularly, could add another half- degree Celsius (0.9 degrees Fahrenheit) of warming on top of whatever else the planet has experienced by that time.

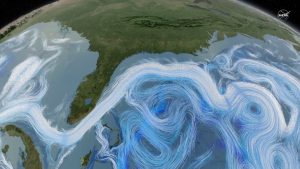
The Washington Post article has a few nice animated graphics. The graph and map here is from the sea ice sections of the Arctic Report Card: Update for 2018 – Effects of persistent Arctic warming continue to mount from NOAA. The Arctic Report card contains a half dozen charts and graphs including one that compares March and September sea ice extent. A data and project for this is in our Statistics Project page.

How are beavers creating a climate feedback loop?

Credit Jay Frandsen/Parks Canada

The New York Times article, Beavers Emerge as Agents of Arctic Destruction, explains:

… as climate change warms the Arctic and thaws the permafrost, the growing season extends. What was once tundra gives way to brush.

This may allow beavers to move north.

But in the tundra, the vast treeless region in the Far North, beaver behavior creates new water channels that can thaw the permanently frozen ground, or permafrost.

What remains is a pitted landscape, with boggy depressions, that directs warmer water onto the permafrost, leading to further thawing. As permafrost thaws it releases carbon dioxide and methane, which in turn contributes to global warming and helps increase the speed that the Arctic, which is already warming faster than the rest of the planet, defrosts.

This is an interesting article with satellite photos showing how beavers have changed the landscape.

Greenland Ice, Changing Albedo, and a Feedback Loop

The BBC reports: Sea Level Fears as Greenland Darkens. The article discusses a possible feedback loop where as temperatures warm algae growth may flourish, which darkens the surface and changes the albedo to increase melting.

One concern now is that rising temperatures will allow algae to flourish not only on the slopes of the narrow margins of the ice-sheet but also on the flat areas in the far larger interior where melting could happen on a much bigger scale.

We joined the latest phase of research in which scientists set up camp on the ice-sheet to gather accurate measurements of the “albedo” or the amount of solar radiation reflected by the surface.

White snow reflects up to 90% of solar radiation while dark patches of algae will only reflect about 35% or even as little as 1% in the blackest spots.

Other highlights from the article include:

Currently the Greenland ice sheet is adding up to 1mm a year to the rise in the global average level of the oceans.

It is the largest mass of ice in the northern hemisphere covering an area about seven times the size of the United Kingdom and reaching up to 3km (2 miles) in thickness.

This means that the average sea level would rise around the world by about seven metres, more than 20ft, if it all melted.

You can get Greenland Ice Data from NASA’s Vital Signs of the Planet page as noted in a past post.

Oceans as a Heat Sink: Possible Feedback Loop

Ocean currents are a complex mechanism that contribute to absorbing CO2 and heat. The NASA article, NASA-MIT study evaluates efficiency of oceans as heat sink – atmospheric gases sponge, discusses the role of ocean currents as part of climate change. The possible feedback loop is suggested by this:

In addition, they found that in scenarios where the ocean current slows down due to the addition of heat, the ocean absorbs less of both atmospheric gases and heat, though its ability to absorb heat is more greatly reduced.

The article includes this must see 40 seconds animation of ocean currents and a engaging 3D graph with the depth of the ocean as the z-axis:

Arctic Ice and Global Warming

An article from this past February, Rapid warming and disintegrating polar ice set the stage for ‘societal collapse’ – Carbon pollution is destabilizing both the Arctic and Antarctic, provides a nice overview of issues of warming and ice. For instance, there is the albedo feedback loop:

Climate models have long predicted that if we keep using the atmosphere as an open sewer for carbon pollution, the ice cap would eventually enter into a death spiral because of Arctic amplification — a vicious cycle where higher temperatures melt reflective white ice and snow, which is replaced by the dark land or blue sea, which both absorb more solar energy, leading to more melting.

The graph here is historical January Arctic ice extent and the data can be downloaded from the National Snow and Ice Data Center Sea Ice Data and Analysis Tools page.  Go to Sea ice analysis data spreadsheets and then to monthly data by year. As you’ll see there is other data there worth exploring. There are projects using Arctic ice data on both the calculus and statistics pages on this blog. If you are a real ice junkie take a look at the interactive sea ice graph and keep track of the current ice extent.  Finally, as a reader of this blog you know that you can make your own global temperature maps like the one in the article from reading April Second Warmest on Record.


A Feedback Loop: The Alaska Tundra

A recent NASA report Alaska tundra source of early-winter carbon emissions provides another example of a feedback loop. Global warming has slowed the refreezing of the Alaska tundra allowing for increased CO2 releases.

A new paper led by Roisin Commane, an atmospheric researcher at Harvard University in Cambridge, Massachusetts, finds the amount of carbon dioxide emitted from northern tundra areas between October and December each year has increased 70 percent since 1975.

“In the past, refreezing of soils may have taken a month or so, but with warmer temperatures in recent years, there are locations in Alaska where tundra soils now take more than three months to freeze completely,” said Commane. “We are seeing emissions of carbon dioxide from soils continue all the way through this early winter period.”

How much carbon is stored in the frozen soils. According to the report

The soils that encircle the high northern reaches of the Arctic (above 60 degrees North latitude) hold vast amounts of carbon in the form of undecayed organic matter from dead vegetation. This vast store, accumulated over thousands of years, contains enough carbon to double the current amount of carbon dioxide in Earth’s atmosphere.