Tag Archives: GIS Data

How much of the West is in drought?

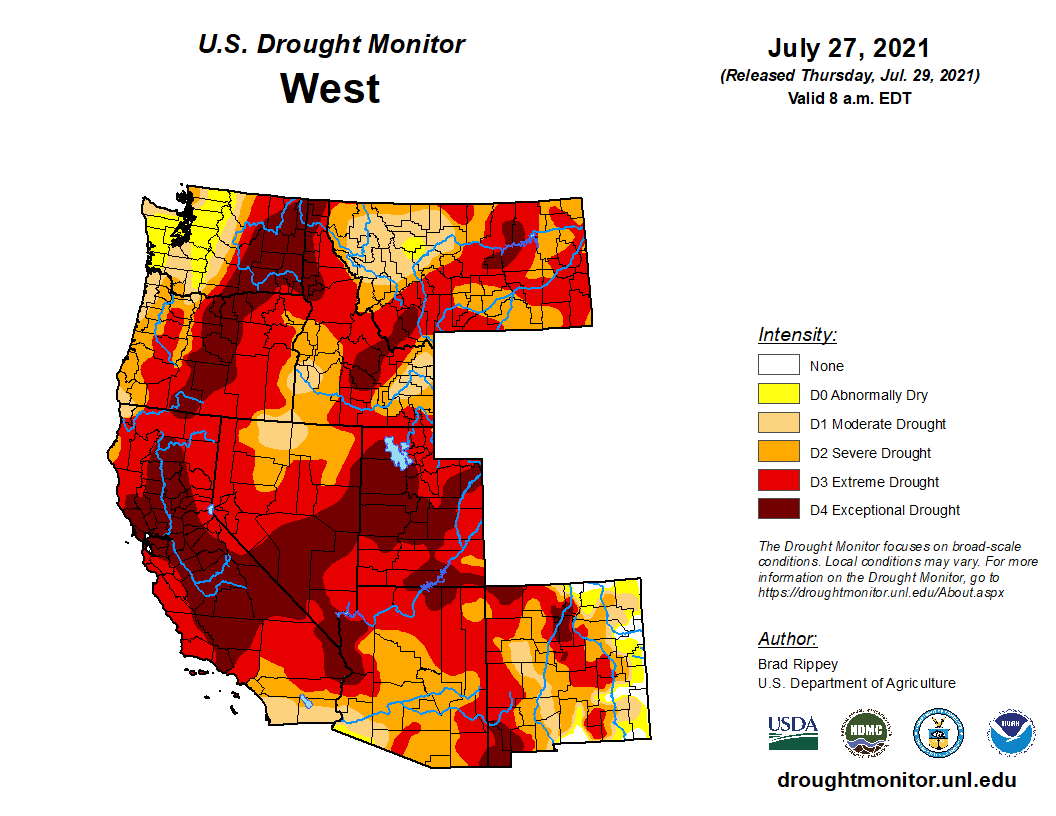
Over 99% of the West has been in drought for the month of July and 4/6/2021 was the last time it was below 90%. Roughly 25% has been in exceptional drought since May. Over 60 million people (about 20% of the U.S. population) are estimated in the drought areas in the West. The definition of exceptional drought:

  • Exceptional and widespread crop/pasture losses

  • Shortages of water in reservoirs, streams, and wells creating water emergencies

The U.S. Drought Monitor has data for download including time series and GIS files.

How is the Greenland Ice Sheet Creating Change?

From NASA’s Vital Signs of the Planet feature Greenland’s Retreating Glaciers Could Impact Local Ecology (10/27/2020):

A new study of Greenland’s shrinking ice sheet reveals that many of the island’s glaciers are not only retreating, but are also undergoing other physical changes. Some of those changes are causing the rerouting of freshwater rivers beneath the glaciers, where it meets the bedrock. These rivers carry nutrients into the ocean, so this reconfiguring has the potential to impact the local ecology as well as the human communities that depend on it.

Some calculus language in the article:

Multiple studies have shown that the melting ice sheet is losing mass at an accelerating rate due to rising atmosphere and ocean temperatures, and that the additional meltwater is flowing into the sea.

The visualization copied here shows the flow velocity of the glaciers (white – slow, magenta – fastest). The article links to the ITS_LIVE data page with glacier data (mostly GIS). Greenland and Antarctica glacier mass times series data here.