Tag Archives: GIS

How do we explore invasive aquatic species in the Great Lakes basin?

The Great Lakes Aquatic Nonindigenous Species Information System (GLANSIS) is

designed to to be a “one-stop shop” for information about non-native species in the Great Lakes. GLANSIS hosts regional data about identification, ecology, distribution, environmental and socioeconomic impacts, management, and control of nonindigenous species throughout the Great Lakes basin, along with bibliographic material, risk assessments, and other resources.

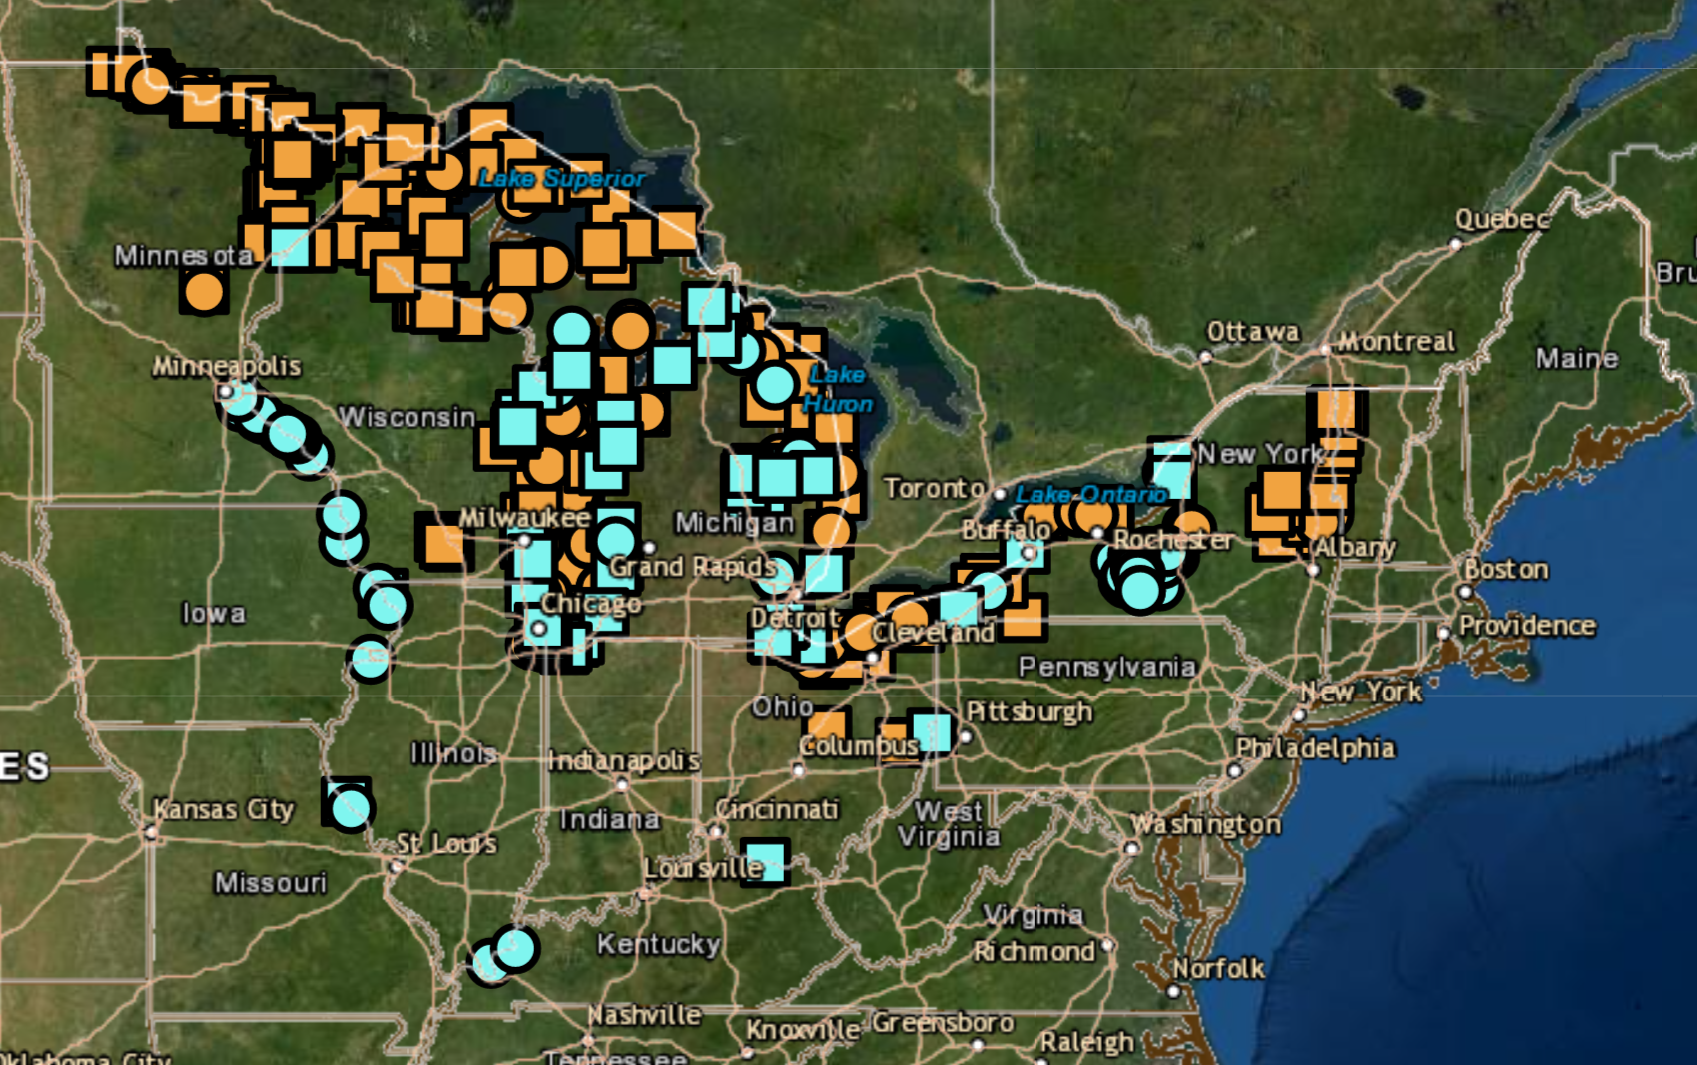
If you click on Map Explorer you can make the map here which shows the distribution of Bythotrephes longimanus (Spiny Waterflea – orange) and Echinogammarus ischnus (scud – blue). One nice thing about the Map Explorer is you can easily download a csv file of the data which includes lat long  coordinates (use it in your favorite GIS software). There are also dates so the data can be used as a time series.  Using the GLANSIS Map Explorer by El Lower, Austin Bartos, and Rochelle Stuttevant (8/11/2021) provides an nice intro to the site.

What is the Vegetative Health Index?

From the NOAA STAR Center for Satellite Applications and Research page:

Global and Regional Vegetation Health (VH) is a NOAA/NESDIS system estimating vegetation health, moisture condition, thermal condition and their products.

It contains Vegetation Health Indices (VHI) derived from the radiance observed by the Advanced Very High Resolution Radiometer (AVHRR) onboard afternoon polar-orbiting satellites: the NOAA-7, 9, 11, 14, 16, 18 and 19 and VIIRS from Soumi-NPP satellite.

And

The VH products can be used as proxy data for monitoring vegetation health, drought, soil saturation, moisture and thermal conditions, fire risk, greenness of vegetation cover, vegetation fraction, leave area index, start/end of the growing season, crop and pasture productivity, teleconnection with ENSO, desertification, mosquito-borne diseases, invasive species, ecological resources, land degradation, etc.

The following indices and products are available:
Vegetation Health (VHI)
Vegetation Condition Index (VCI)
Temperature Condition Index (TCI)
Soil Saturation Index (SSI)
No noise Normalized Difference Vegetation Index (SMN)
No noise Brightness Temperature (SMT)
and more.

There is a page with maps (and links to shapefiles) and an interactive page with time series graphs for different states. The one for NY is copied here. It seems like there are some uses for stats courses tied to correlations with temperature (and you can add climate max/min to the graphs) and more. There is a page to download data (see left sidebar) but you’ll have to be able to handle netcdf files.