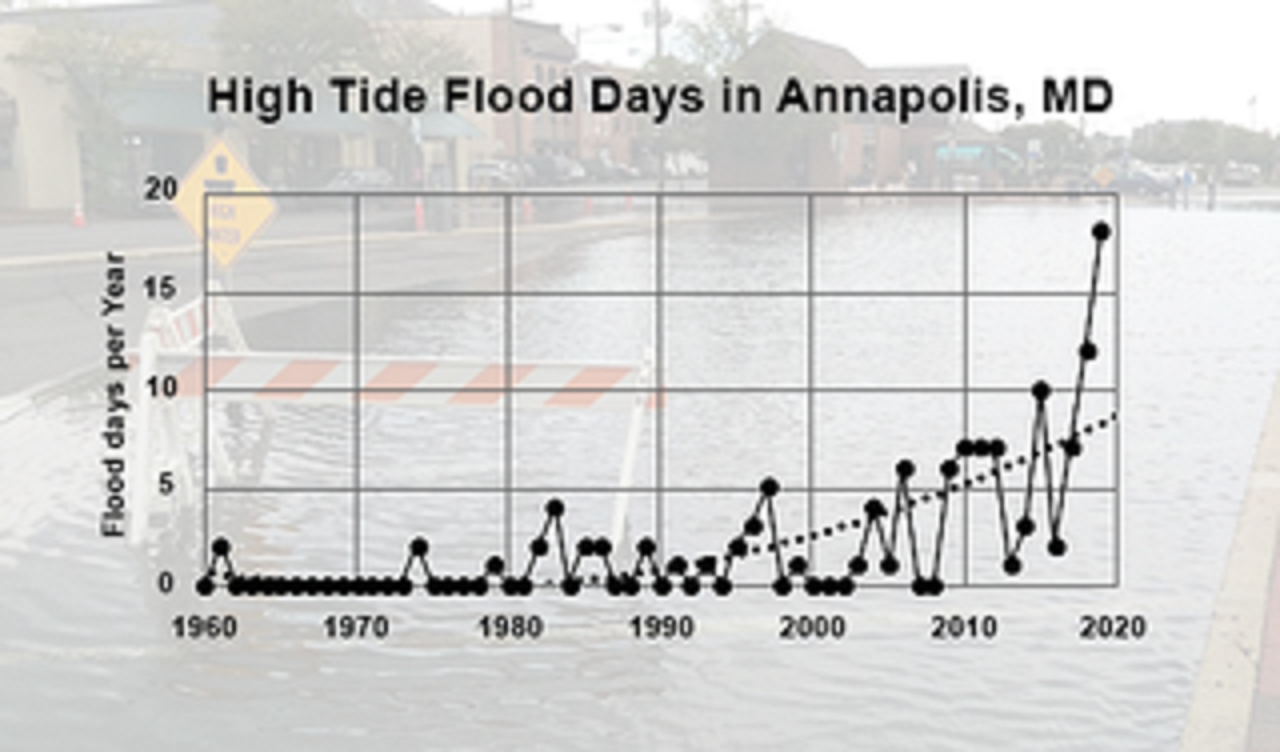
NASA’s Vital Signs of the Planet article Beating Back the Tides by Jenny Marder (11/11/2020) provides an update on the increasing frequency of high tides (see the graph copied here for one example).
Between 2000 and 2015, high-tide flooding in the U.S. doubled from an average of three days per year to six along the Northeast Atlantic, according to a 2018 NOAA report. It is especially common along the East Coast and Gulf Coast, where the frequency is up by roughly 200% over the last two decades. In some areas like Annapolis, the numbers are even more extreme. Annapolis had a record 18 days of high-tide flooding from May 2019 to April 2020, according to flooding thresholds for the city established by NOAA. That’s up from the previous record of 12 days in 2018. Before 2015, the record number of high-tide flood days in one year was seven, and the yearly average of high-tide floods from 1995 to 2005 was two.
The article includes a 7 minute video on high tide flooding. There is also a link to NOAA’s Tides and Currents page The State of High Tide Flooding and Annual Outlook. The page has a map of projected high tide flood days for 2020. For more detailed information, including lots of graphs, see the 2019 State of U.S. High Tide Flooding with 2020 Outlook technical report from NOAA.