If you’d like local trends of sea level rise then check out NOAA’s Sea Level Trends page.
The sea level trends measured by tide gauges that are presented here are local relative sea level (RSL) trends as opposed to the global sea level trend. Tide gauge measurements are made with respect to a local fixed reference on land. RSL is a combination of the sea level rise and the local vertical land motion.
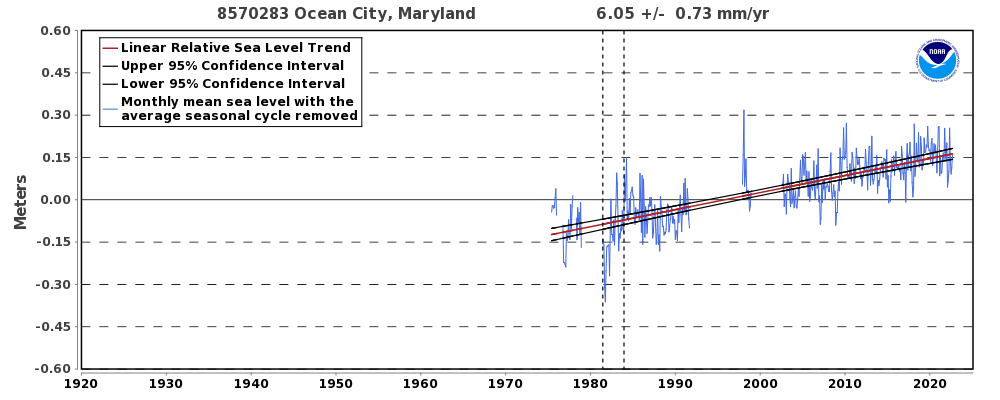
On the landing page you are greeted with a map with colored arrows. The arrows point up for an increase and down for a decrease in sea level locally. The color of the arrow is represents magnitude. Click on an arrow to get details. For instance for Ocean City, MD we learn
The relative sea level trend is 6.05 mm/year with a 95% confidence interval of +/- 0.73 mm/year based on monthly mean sea level data from 1975 to 2021 which is equivalent to a change of 1.98 feet in 100 years.
Note that the 100 year projection assume a linear increase, which may not be the case. The pop up box includes links to four times of graphs. The one presented here is the linear trend graph. Under the graph for average seasonal cycle we learn
The average seasonal cycle of mean sea level, caused by regular fluctuations in coastal temperatures, salinities, winds, atmospheric pressures, and ocean currents, is shown along with each month’s 95% confidence interval.
The graphs include links to the data. Great QL resource and a place to get ample time series data.