Tag Archives: Greenland

How fast is runoff from Greenland ice sheet increasing?

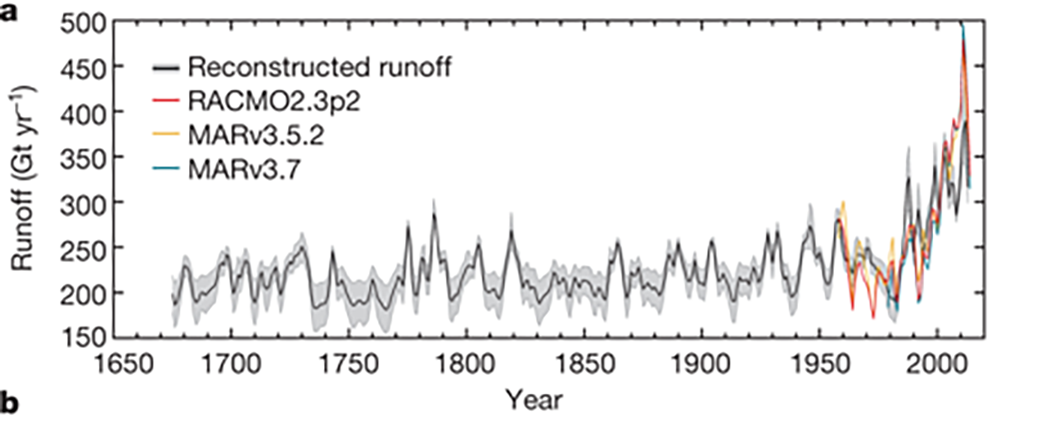
The Nature article Nonlinear rise in Greenland runoff in response to post-industrial Arctic warming by Luke Trusel et. el. (12/5/18)  reports on Greenland ice sheet runoff.  Referring to fig 4a (copied here) in their paper

We show that an exceptional rise in runoff has occurred over the last two decades, equating to an approximately 50% increase in GrIS-integrated runoff compared to pre-industrial runoff, and a 33% increase over the twentieth century alone.

The Woods Hole Oceanographic Institution (WHOI) provides a less technical summary of the paper in their post Greenland Ice Sheet Melt ‘Off the Charts’ Compared With Past Four Centuries (12/5/18).

Ice loss from Greenland is one of the key drivers of global sea level rise. Icebergs calving into the ocean from the edge of glaciers represent one component of water re-entering the ocean and raising sea levels. But more than half of the ice-sheet water entering the ocean comes from runoff from melted snow and glacial ice atop the ice sheet. The study suggests that if Greenland ice sheet melting continues at “unprecedented rates”—which the researchers attribute to warmer summers—it could accelerate the already fast pace of sea level rise.

“Rather than increasing steadily as climate warms, Greenland will melt increasingly more and more for every degree of warming. The melting and sea level rise we’ve observed already will be dwarfed by what may be expected in the future as climate continues to warm,” said Trusel.

The WHOI post includes a short video with a graph similar to the one copied here and a summary of the science.  The Nature article has data available.

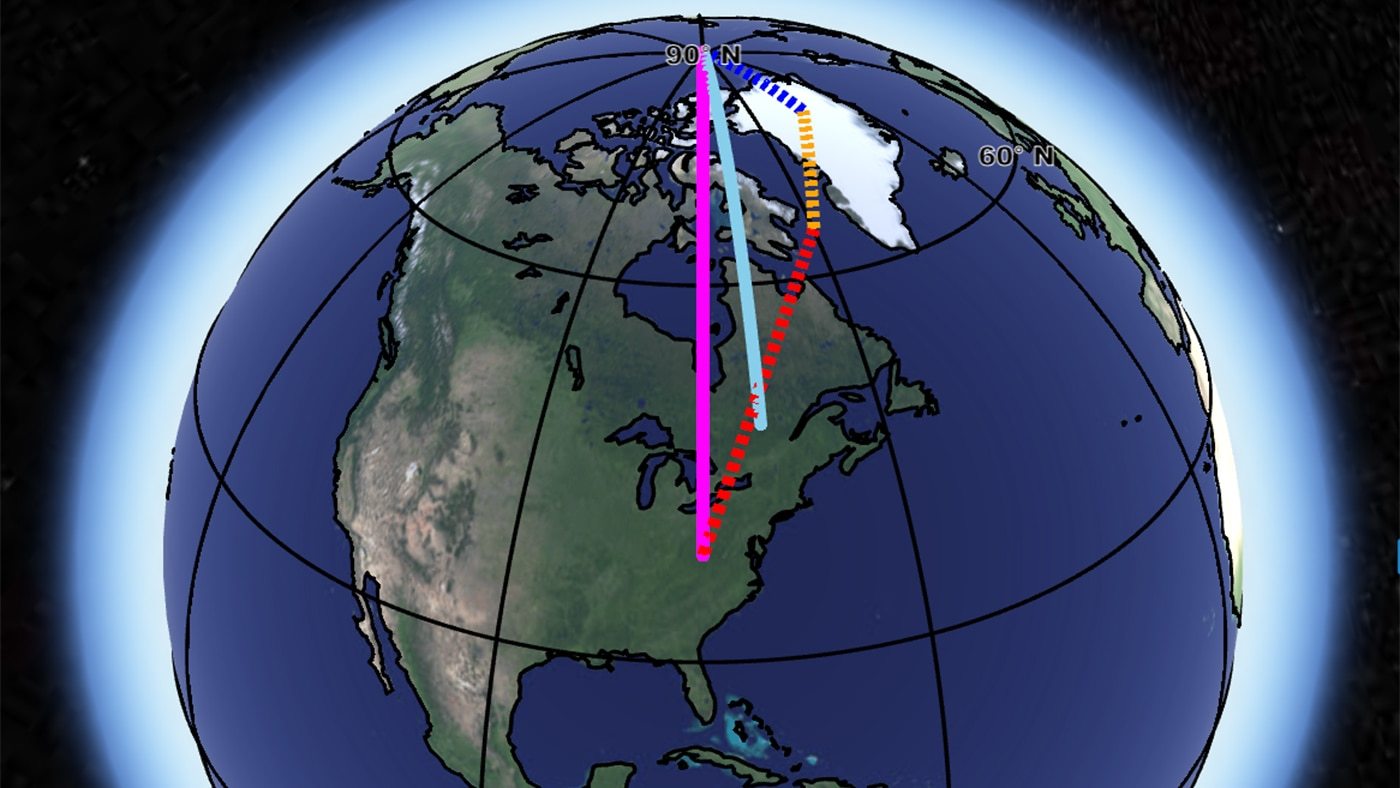
As an aside, while we are talking about Greenland,  in NASA news International team – NASA make unexpected discovery under Greenland ice (11/15/18)

An international team of researchers, including a NASA glaciologist, has discovered a large meteorite impact crater hiding beneath more than a half-mile of ice in northwest Greenland. The crater — the first of any size found under the Greenland ice sheet — is one of the 25 largest impact craters on Earth, measuring roughly 1,000 feet deep and more than 19 miles in diameter, an area slightly larger than that inside Washington’s Capital Beltway.

The NASA article includes a short video.

How does climate change impact the spin axis of the planet?

Source: NASA

NASA’s Vital Signs of the planet post, Scientists ID three causes of Earth’s spin axis drift (9/19/18) explains changes in the spin axis.

Earth is not a perfect sphere. When it rotates on its spin axis — an imaginary line that passes through the North and South Poles — it drifts and wobbles. These spin-axis movements are scientifically referred to as “polar motion.” Measurements for the 20th century show that the spin axis drifted about 4 inches (10 centimeters) per year. Over the course of a century, that becomes more than 11 yards (10 meters).

In general, the redistribution of mass on and within Earth — like changes to land, ice sheets, oceans and mantle flow — affects the planet’s rotation. As temperatures increased throughout the 20th century, Greenland’s ice mass decreased. In fact, a total of about 7,500 gigatons — the weight of more than 20 million Empire State Buildings — of Greenland’s ice melted into the ocean during this time period. This makes Greenland one of the top contributors of mass being transferred to the oceans, causing sea level to rise and, consequently, a drift in Earth’s spin axis.

The article explains why the Greenland Ice sheet has such an impact. NASA has also produced an interactive simulation on how different processes contribute to the wobble. There could be a nice vector calculus, linear algebra, or geometry exercises here.

What is the connection between Greenland and the East Coast of the U.S.?

In NASA’s post, Greenland melt speeds East Coast sea level rise, they explain:

The recent work reveals a substantial acceleration in sea level rise, roughly from Philadelphia south, starting in the late 20th century. And it is likely a strong confirmation of sea-level “fingerprints,” one of the most counter-intuitive effects of large-scale melting: As ice vanishes, the loss of its gravitational pull lowers sea level nearby, even as sea level rises farther away.

Their analysis shows that the Greenland and Antarctic influence alone would account for an increase in the rate of sea level rise on the East Coast of 0.0016 to 0.0059 inches (0.04 to 0.15 millimeters) each year, varying by location. That’s equivalent to 7.8 inches (0.2 meters) of sea-level rise on the northern East Coast over the next century, and 2.5 feet (0.75 meters) in the south, though the estimates are quantitative and not an attempt at an actual projection.

Emphasis here in increase as this is in addition to the increases based on the meted water and thermal expansion of the water. Connected to this article, is the graph here, change in Greenland ice in Gt, which is from NASA’s Greenland page where you can also get the data.

Greenland Ice, Changing Albedo, and a Feedback Loop

The BBC reports: Sea Level Fears as Greenland Darkens. The article discusses a possible feedback loop where as temperatures warm algae growth may flourish, which darkens the surface and changes the albedo to increase melting.

One concern now is that rising temperatures will allow algae to flourish not only on the slopes of the narrow margins of the ice-sheet but also on the flat areas in the far larger interior where melting could happen on a much bigger scale.

We joined the latest phase of research in which scientists set up camp on the ice-sheet to gather accurate measurements of the “albedo” or the amount of solar radiation reflected by the surface.

White snow reflects up to 90% of solar radiation while dark patches of algae will only reflect about 35% or even as little as 1% in the blackest spots.

Other highlights from the article include:

Currently the Greenland ice sheet is adding up to 1mm a year to the rise in the global average level of the oceans.

It is the largest mass of ice in the northern hemisphere covering an area about seven times the size of the United Kingdom and reaching up to 3km (2 miles) in thickness.

This means that the average sea level would rise around the world by about seven metres, more than 20ft, if it all melted.

You can get Greenland Ice Data from NASA’s Vital Signs of the Planet page as noted in a past post.

Greenland Ice Mass and Data

Vital Signs of the Planet from NASA is a place for graphs and data. The graph here is change in the mass of the Greenland Ice Sheet. On the Land Ice page there is also a graph of changes in the Antarctica Ice. Underneath each graph is a link to data (HTTP), which will give you data for both Greenland and Antarctica ice as well as sea level change. All three sets can be used for linear regression or multiple regression predicting sea level change based on both ice mass changes (recall that melting sea ice doesn’t raise sea levels but land ice does).