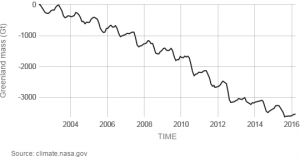
Vital Signs of the Planet from NASA is a place for graphs and data. The graph here is change in the mass of the Greenland Ice Sheet. On the Land Ice page there is also a graph of changes in the Antarctica Ice. Underneath each graph is a link to data (HTTP), which will give you data for both Greenland and Antarctica ice as well as sea level change. All three sets can be used for linear regression or multiple regression predicting sea level change based on both ice mass changes (recall that melting sea ice doesn’t raise sea levels but land ice does).

