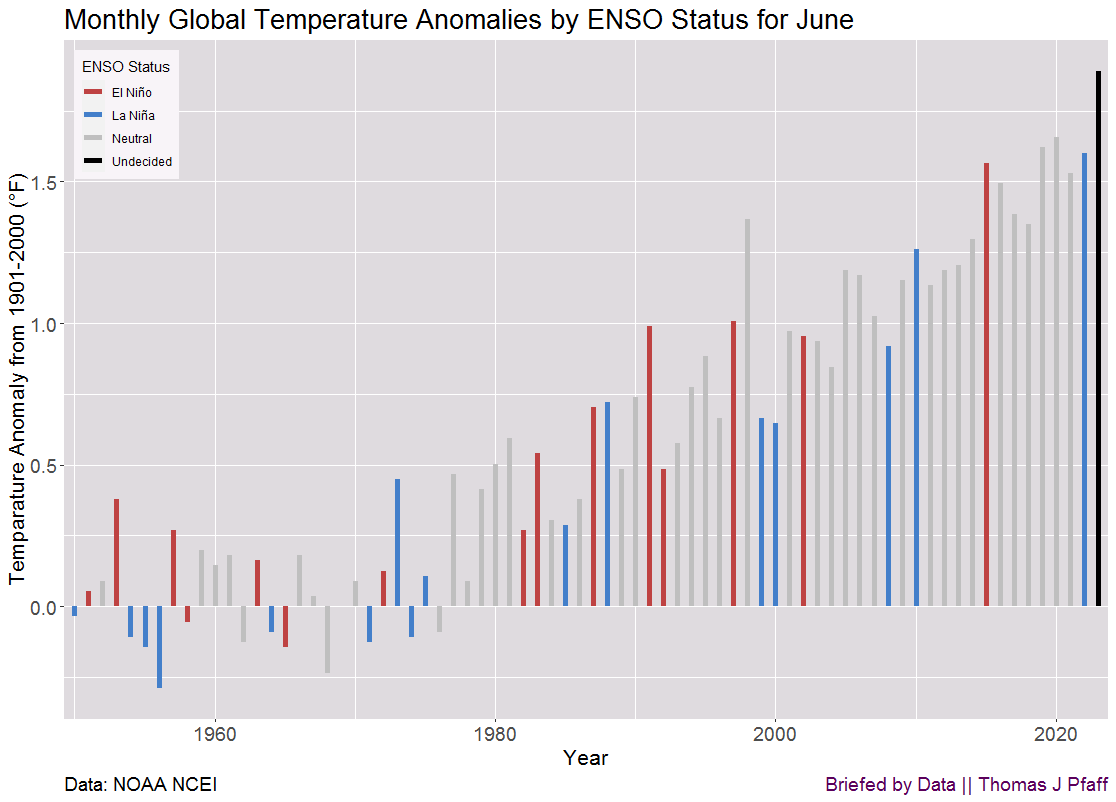
Note: This first appeared on my Briefed by Data site. Here is my monthly update of temperature anomalies. As you’ll see, June 2024 did set a record, but when you look at the all-months graph, the last black bar is no higher than some past neutral ENSO months. Here is what NOAA has to say about June 2024 (bold mine):
June 2024 was the warmest June on record for the globe in NOAA’s 175-year record. The June global surface temperature was 1.22°C (2.20°F) above the 20th-century average of 15.5°C (59.9°F). This is 0.15°C (0.27°F) warmer than the previous June record set last year, and the 13th consecutive month of record-high global temperatures. This ties with May 2015-May 2016 for the longest record warm global temperature streak in the modern record (since 1980). June 2024 marked the 48th consecutive June with global temperatures, at least nominally, above the 20th-century average.
Global land-only June temperature also was warmest on record at 1.75°C (3.15°F) above average. The ocean-only temperature also ranked warmest on record for June at 0.98°C (1.76°F) above average, 0.05°C (0.09°F) warmer than the previous record warm June last year, and the 15th-consecutive monthly ocean record high. These record temperatures occurred under ENSO-neutral conditions. According to NOAA’s Climate Prediction Center, ENSO-neutral conditions are present and La Niña is favored to develop during July-September (65% chance) and persist into the Northern Hemisphere winter 2024-25 (85% chance during November-January).
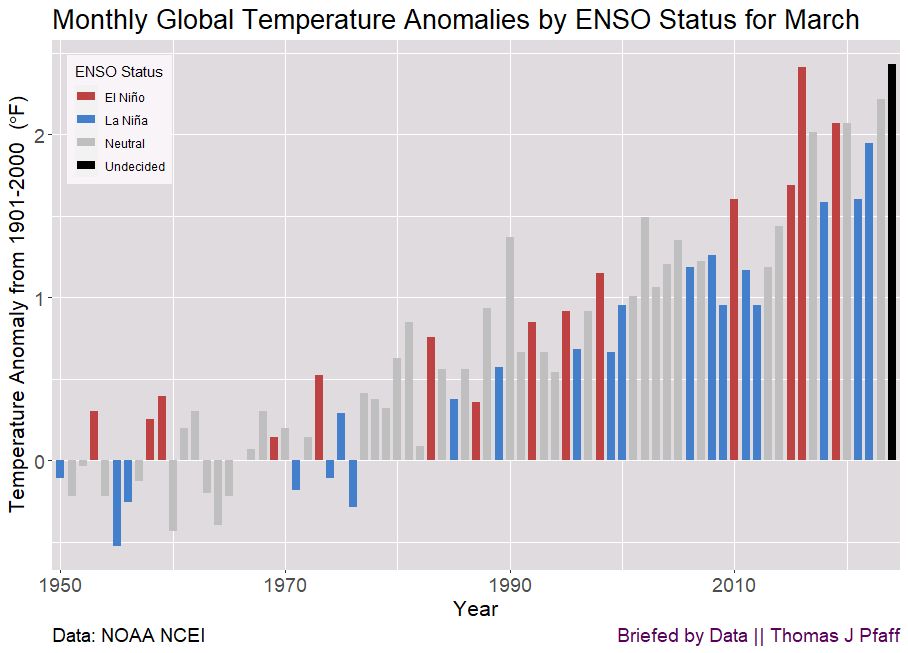
As we head into La Niña, we should expect anomalies to be around 2°F by following the blue bar trend in the all-month graph. Overall, we should expect that we won’t set anomaly records each month, but we will likely set La Niña anomalies records; the blue bars are increasing themselves.