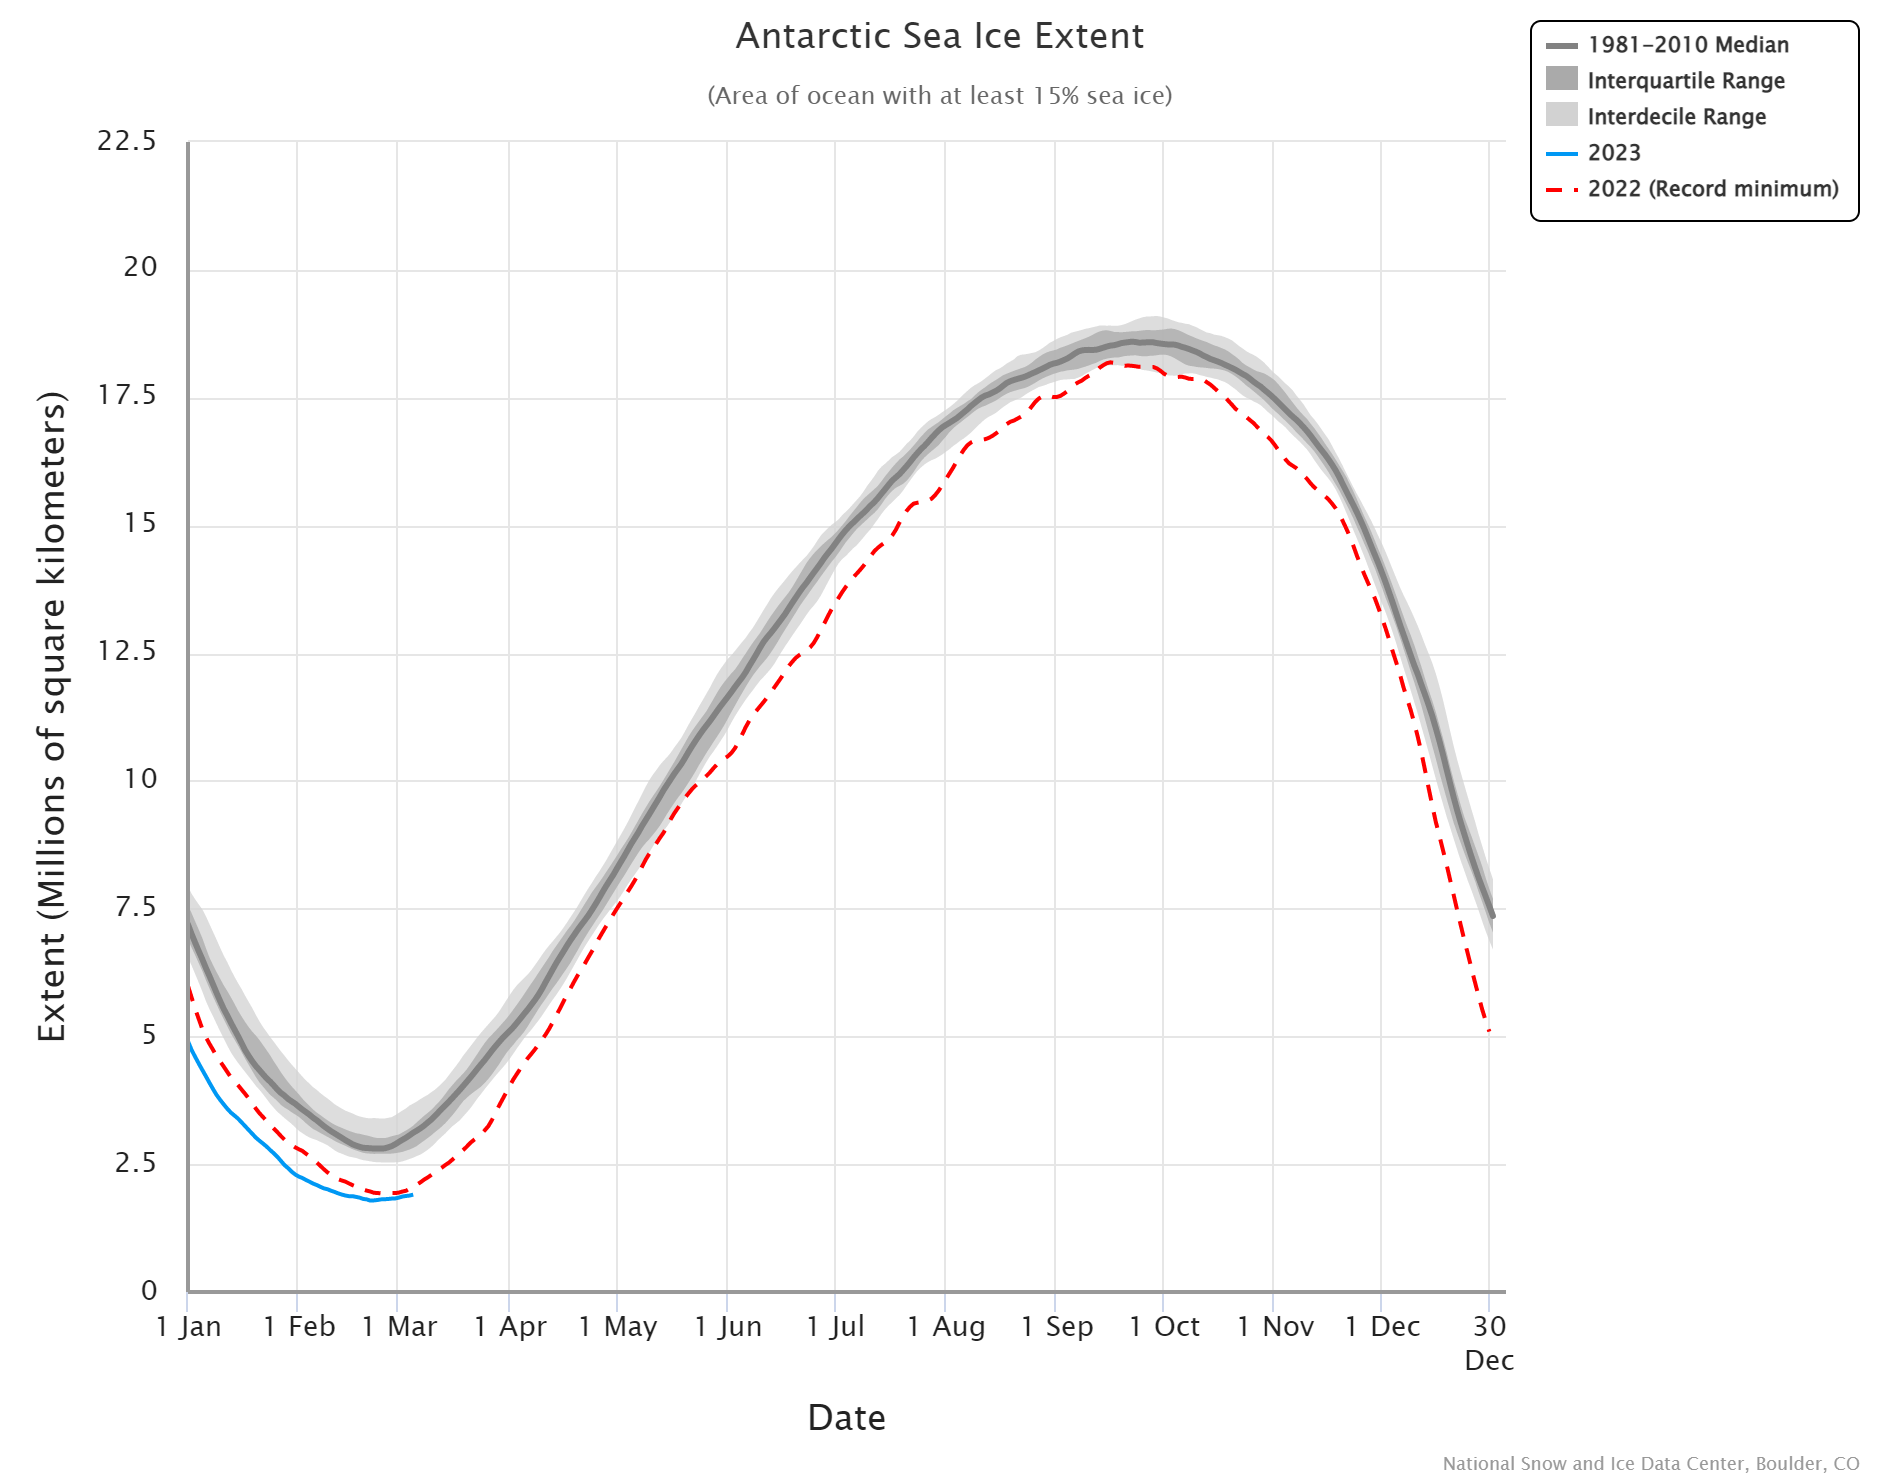
 The Antarctic set a new record sea ice minimum at 1.788 million square kilometers beating out last years 1.924 million square kilometers. The graph here comes from the National Snow and Ice Data Center’s (NSIDC) Charctic Interactive Sea Ice Graph. This is a great tool that allows the user to select Arctic or Antarctic, choose color schemes, and select the years to display. A link near the top right corner of the graph allows users to download the data and the graph.
How old is Arctic sea ice?
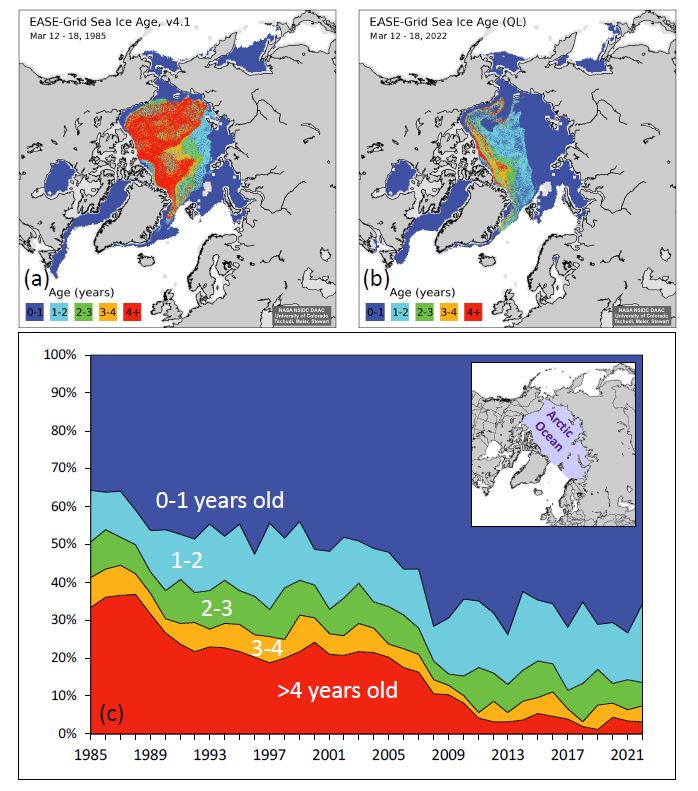 The NSIDC page Springtime in the Artic (5/3/2022) has a section on sea ice age.
At the end of last summer, the extent of the oldest ice (greater than 4 years old) tied with 2012 for the lowest in the satellite record. This spring, we continue to see a dominance of first-year ice (Figure 4). The percentage of the greater than 4-year-old ice, which once comprised over 30 percent of the Arctic Ocean, now makes up only 3.1 percent of the ice cover.
The page has other graphs and maps related to ice. There is a link in the citations for data related to the graph copied here.
What is a gigatonne of ice?
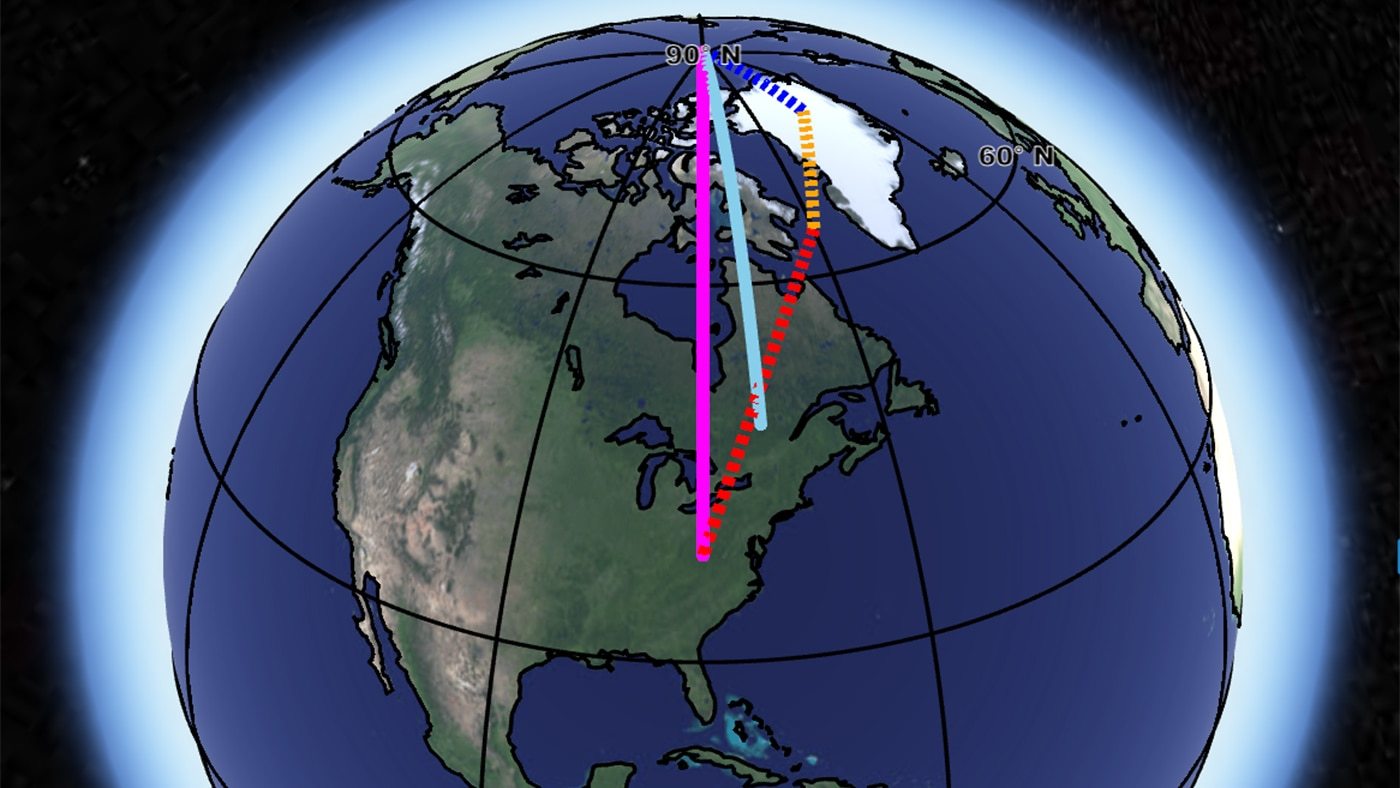
 The picture here is a snapshot from an animation by NASA in the article Visualizing the Quantities of Climate Change – Ice Sheet Loss in Greenland and Antarctica by Matt Conlen (3/9/2020) that shows a gigatonne of ice. A gigatonne isn’t much since
Satellite data show that Greenland and Antarctica are losing mass at a rate of 283 gigatonnes per year and 145 gigatonnes per year, respectively.
There are three animations one for 1 gigatonne, 5,000 gigatonnes (about the amount lost from the polar ice caps from 2002-2017), and 49,000 gigatones (estimate of the amount lost in the 20th century). Each animation also has an associated math box for the related calculation.
How well do you know Antarctica?
The Climate.gov article Antarctica is colder than the Arctic – but it’s still losing ice by Michon Scott (3/121/19) is a detailed primer on Antarctica and it’s relation to climate change. Some basic facts about Antarctica:
Thanks to thick ice, Antarctic elevation averages more than 6,000 feet (more than a mile above sea level). The very highest parts of the ice sheet, near the center of East Antarctica, rival the height of its tallest mountains, at nearly 13,500 feet.
Antarctica’s interior gets so little precipitation that it counts among the world’s driest deserts. Air masses reaching the high-elevation interior are usually stripped of moisture. The U.S. Antarctic Program reports that, continent-wide, Antarctica receives an average of roughly 2 inches of precipitation per year. (Phoenix, Arizona, gets about 7.5 inches of annual precipitation.)
Is Antarctica warming? It’s complicated:
The Intergovernmental Panel on Climate Change (IPCC) synthesis report published in 2014 found a warming trend over Antarctica, but expressed low confidence that the warming was caused by human activities. In the late twentieth century, the ozone hole and its effects on air circulation may have partly shielded the continent from the global warming influence of greenhouse gas emissions. Continued success in addressing the ozone hole, along with fossil fuel emissions, may cause Antarctic temperatures to rise more rapidly in future decades.
West of the Antarctic Peninsula, measurements dating back to the 1950s show a strong warming trend in the upper ocean: nearly 2.7°F. Meanwhile, waters of the Arctic Circumpolar Current (ACC), far below the surface, have warmed faster than the rest of the global ocean. Between depths of 1,000 and 3,000 feet, ACC temperatures rose by 0.11°F per decade between the 1960s and the 2000s. Between the 1980s and 2013, ACC temperatures at those depths rose by 0.16°F per decade.
What about ice melting?
In contrast with the Arctic—where climate change is amplified, and sea ice shows a clear declining trend over time—Antarctic sea ice does not show a significant overall trend in either the summer or the winter. One region, south and west of the Antarctic Peninsula, has shown a persistent decline, but this trend is small relative to the high variability of the other Antarctic sea ice regions. In 2015, sea ice experts concluded that the small gains in Antarctic sea ice in some seasons were not enough to cancel out Arctic losses, and so globally, sea ice was declining. That basic conclusion remains true in early 2019.
But what if all the ice on the continent melted?
If the entire Antarctic Ice Sheet were to melt at once, it would raise global sea level more than 180 feet. Outside of an epic natural disaster such as an asteroid slamming into Antarctica, that ice sheet isn’t going to melt entirely for centuries, but it will contribute to sea level rise over the next century. The question is: How much? The exact answer is elusive. The IPCC Fifth Assessment Report (AR5) states that the effect of Antarctic ice sheets on sea level rise over the coming century is a major unknown. Not only is the ice sheet melt rate challenging to measure precisely, but other events could accelerate sea level rise, and it’s hard to know when or even if those events will occur.
Read the article and get to know Antarctica. The is ample stats and QL classroom opportunities and graphs in the article.
Follow Up: How old is Arctic Ice?
 In a follow up to our May 28, 2018 post, How old is Arctic Ice?, the Washington Post has an article, The Arctic Ocean has lost 95 percent of its oldest ice — a startling sign of what’s to come by Chris Mooney (12/11/18). It notes:
In 1985, the new NOAA report found, 16 percent of the Arctic was covered by the very oldest ice, more than four years old, at the height of winter. But by March, that number had dropped to under 1 percent. That’s a 95 percent decline.
At the same time, the youngest, first-year ice has gone from 55 percent of the pack in the 1980s to 77 percent, the report finds. (The remainder is ice that is two to three years old.)
The loss of sea ice creates a feedback loop:
There is a well-known feedback loop in the Arctic, caused by the reflectivity of ice and the darkness of the ocean. When the Arctic Ocean is covered by lighter, white ice, it reflects more sunlight back to space. But when there is less ice, more heat gets absorbed by the darker ocean — warming the planet further. That warmer ocean then inhibits the growth of future ice, which is why the process feeds upon itself.
and
Because of this, Arctic sea ice loss has already increased the warming of the planet as a whole. Ramanathan said the impact is equivalent to the warming effect of 250 billion tons of carbon dioxide emissions, or about six years of global emissions.
Ramanathan fears that entirely ice-free summers, if they began to occur regularly, could add another half- degree Celsius (0.9 degrees Fahrenheit) of warming on top of whatever else the planet has experienced by that time.
The Washington Post article has a few nice animated graphics. The graph and map here is from the sea ice sections of the Arctic Report Card: Update for 2018 – Effects of persistent Arctic warming continue to mount from NOAA. The Arctic Report card contains a half dozen charts and graphs including one that compares March and September sea ice extent. A data and project for this is in our Statistics Project page.
How fast is runoff from Greenland ice sheet increasing?
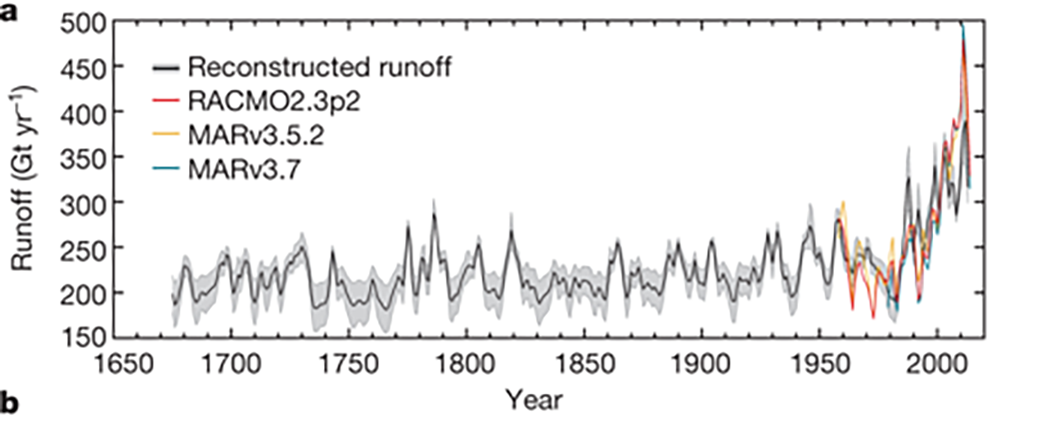 The Nature article Nonlinear rise in Greenland runoff in response to post-industrial Arctic warming by Luke Trusel et. el. (12/5/18) reports on Greenland ice sheet runoff. Referring to fig 4a (copied here) in their paper
We show that an exceptional rise in runoff has occurred over the last two decades, equating to an approximately 50% increase in GrIS-integrated runoff compared to pre-industrial runoff, and a 33% increase over the twentieth century alone.
The Woods Hole Oceanographic Institution (WHOI) provides a less technical summary of the paper in their post Greenland Ice Sheet Melt ‘Off the Charts’ Compared With Past Four Centuries (12/5/18).
Ice loss from Greenland is one of the key drivers of global sea level rise. Icebergs calving into the ocean from the edge of glaciers represent one component of water re-entering the ocean and raising sea levels. But more than half of the ice-sheet water entering the ocean comes from runoff from melted snow and glacial ice atop the ice sheet. The study suggests that if Greenland ice sheet melting continues at “unprecedented rates”—which the researchers attribute to warmer summers—it could accelerate the already fast pace of sea level rise.
“Rather than increasing steadily as climate warms, Greenland will melt increasingly more and more for every degree of warming. The melting and sea level rise we’ve observed already will be dwarfed by what may be expected in the future as climate continues to warm,” said Trusel.
The WHOI post includes a short video with a graph similar to the one copied here and a summary of the science. The Nature article has data available.
As an aside, while we are talking about Greenland, in NASA news International team – NASA make unexpected discovery under Greenland ice (11/15/18)
An international team of researchers, including a NASA glaciologist, has discovered a large meteorite impact crater hiding beneath more than a half-mile of ice in northwest Greenland. The crater — the first of any size found under the Greenland ice sheet — is one of the 25 largest impact craters on Earth, measuring roughly 1,000 feet deep and more than 19 miles in diameter, an area slightly larger than that inside Washington’s Capital Beltway.
The NASA article includes a short video.
How well do we understand rising sea levels?

NASA’s Vital Signs of the Planet feature, Keeping score on Earth’s rising seas by Pat Brennan (9/1918) summarizes a recent paper that “ ‘closes’ the sea-level budget to within 0.3 millimeters of sea-level rise per year since 1993.”
A just-published paper assembles virtually all the puzzle pieces – melting ice, warming and expanding waters, sinking coastlines and a stew of other factors – to arrive at a picture of remarkable precision. Since 1993, global sea level has been rising by an average 3.1 millimeters per year, with the rise accelerating by 0.1 millimeter per year, according to the study published Aug. 28 in the journal, “Earth System Science Data.”
“Global mean sea level is not rising linearly, as has been thought before,” said lead author Anny Cazenave of France’s Laboratory for Studies in Geophysics and Oceanography (LEGOS). “We now know it is clearly accelerating.”
The above paragraphs can be used as calculus in the news and sea level data is available from NASA’s Sea Level page.
How does climate change impact the spin axis of the planet?
NASA’s Vital Signs of the planet post, Scientists ID three causes of Earth’s spin axis drift (9/19/18) explains changes in the spin axis.
Earth is not a perfect sphere. When it rotates on its spin axis — an imaginary line that passes through the North and South Poles — it drifts and wobbles. These spin-axis movements are scientifically referred to as “polar motion.” Measurements for the 20th century show that the spin axis drifted about 4 inches (10 centimeters) per year. Over the course of a century, that becomes more than 11 yards (10 meters).
In general, the redistribution of mass on and within Earth — like changes to land, ice sheets, oceans and mantle flow — affects the planet’s rotation. As temperatures increased throughout the 20th century, Greenland’s ice mass decreased. In fact, a total of about 7,500 gigatons — the weight of more than 20 million Empire State Buildings — of Greenland’s ice melted into the ocean during this time period. This makes Greenland one of the top contributors of mass being transferred to the oceans, causing sea level to rise and, consequently, a drift in Earth’s spin axis.
The article explains why the Greenland Ice sheet has such an impact. NASA has also produced an interactive simulation on how different processes contribute to the wobble. There could be a nice vector calculus, linear algebra, or geometry exercises here.
How has Arctic sea ice volume changed?
 The Guardian article Arctic’s strongest sea ice breaks up for first time on record by Jonathan Watts (8/21/18) includes an animated graph of Arctic sea ice volume by year. We produce a similar graph using monthly average ice volume from PIOMAS (source cited for the data in the article). The graph clearly displays the change of ice throughout the year and the loss of ice throughout the years.
Freakish Arctic temperatures have alarmed climate scientists since the beginning of the year. During the sunless winter, a heatwave raised concerns that the polar vortex may be eroding.
This includes the Gulf Stream, which is at its weakest level in 1,600 years due to melting Greenland ice and ocean warming. With lower circulation of water and air, weather systems tend to linger longer.
A dormant hot front has been blamed for record temperatures in Lapland and forest fires in Siberia, much of Scandinavia and elsewhere in the Arctic circle.
The data from PIOMA includes monthly and daily ice volumes. The R script and csv file that produced the graph here can be downloaded.
How fast is Antarctica melting (and a quick calculus project)?
 A recent NYT article, Antarctica Is Melting Three Times as Fast as a Decade Ago by Kendra Pierre-Louis (6/13/2018), states clearly that Antarctica is melting, well, three times faster than a decade ago, which is a rate of change statement. Rapid melting should cause some concern since:
Between 60 and 90 percent of the world’s fresh water is frozen in the ice sheets of Antarctica, a continent roughly the size of the United States and Mexico combined. If all that ice melted, it would be enough to raise the world’s sea levels by roughly 200 feet.
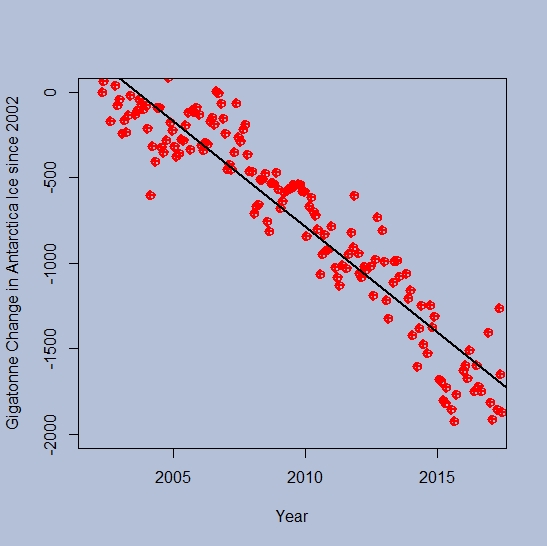
Any calculus student can roughly check the melting statement. Antarctica ice data is available at NASA’s Vital Signs of the Planet Ice Sheets page. There you can download change in Antarctica ice sheet data since 2002. (Note: The NYT article has a graph going back to 1992, but ends in 2017 as does the NASA data.) A quick scatter plot and a regression line shows that the change is not linear and the data set is concave down. (The graph here is the NASA data and produces in R – the Calculus Projects page now has some R scripts for those interested.) Now, a quadratic fit to the data followed by a derivative yields that in 2007 the Antarctica was losing 95 gigatonnes of ice per year and in 2017 it was 195.6 gigatonnes per year. Even with this quick simple method melting has more than doubled from 2007 to 2017. The NYT article states:
While that won’t happen overnight, Antarctica is indeed melting, and a study published Wednesday in the journal Nature shows that the melting is speeding up.
This is an excellent sentence to analyze from a calculus perspective. Given that the current trend in the data is not linear and at least about quadratic, then melting is going to increase each year. On the other hand, maybe they are trying to suggest that melting is increasing more than expected under past trends, for example the fit to the data is more cubic than quadratic. In other words, is the derivative of ice loss linear or something else? If everyone knew calculus the changes in the rate of ice loss could be stated precisely.