Tag Archives: ice

How old is Arctic sea ice?

From the NYT: In the Arctic, the Old Ice Is Disappearing

The NYT article In the Arctic, the Old Ice Is Disappearing by Jeremy White and kendra Pierre-Louis (5/14/2018) notes

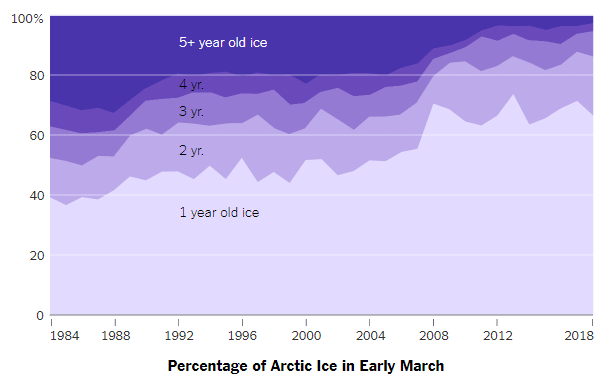
In the Arctic Ocean, some ice stays frozen year-round, lasting for many years before melting. But this winter, the region hit a record low for ice older than five years.

In fact, in March of 1984 5+ year old ice made up about 30% of all ice and now it makes up only a few percent. There is also less ice overall.

If you really want to explore changes in the age of  Arctic ice go to the NSIDC Satellite Observations of Arctic Change interactive graph.  You can choose a year from 1985 through 2916, see a map of the ice, a bar chart of ice by month by age, and have the graph animate through the months of the year. The differences over the years is extreme. You can get related data from the EASE-Grid Sea Ice Age, Version 3 page, although you will have to register.

What is the state of Arctic Sea Ice?

We are within about a month of the peak of Arctic sea ice in its yearly cycle of freezing and thawing. At the moment, sea ice is at a record low (see chart) tracking close to 2017 and 2016, where as 2012 holds the record for the lowest extent of ice. NSID has an interactive real time chart (the last data point here is Feb 25) where you can select any and all years from 1979 to the present and download the graph. The data can be downloaded in an Excel spreadsheet from their Sea Ice Data and Analysis Tools page where they also have links to animations.  There are materials in both the Calculus Projects and Statistics Projects pages using this data.

What is the connection between Greenland and the East Coast of the U.S.?

In NASA’s post, Greenland melt speeds East Coast sea level rise, they explain:

The recent work reveals a substantial acceleration in sea level rise, roughly from Philadelphia south, starting in the late 20th century. And it is likely a strong confirmation of sea-level “fingerprints,” one of the most counter-intuitive effects of large-scale melting: As ice vanishes, the loss of its gravitational pull lowers sea level nearby, even as sea level rises farther away.

Their analysis shows that the Greenland and Antarctic influence alone would account for an increase in the rate of sea level rise on the East Coast of 0.0016 to 0.0059 inches (0.04 to 0.15 millimeters) each year, varying by location. That’s equivalent to 7.8 inches (0.2 meters) of sea-level rise on the northern East Coast over the next century, and 2.5 feet (0.75 meters) in the south, though the estimates are quantitative and not an attempt at an actual projection.

Emphasis here in increase as this is in addition to the increases based on the meted water and thermal expansion of the water. Connected to this article, is the graph here, change in Greenland ice in Gt, which is from NASA’s Greenland page where you can also get the data.

How can we investigate snow cover?

NOAA has a page, Sea Ice and Snow Cover Extent, where you can create graphs for snow cover by four regions (Northern Hemisphere, North America and Greenland, Eurasia, and North America) for each month of the year. For example the graph here is for North America in March. The green line is the average and the red the trend. For each graph you can download the associated data or simply download the graph.

What are Arctic Winter Warming Events?


From NASA’s Vital Signs of the Planet feature, Arctic winter warming events becoming more frequent, longer-lasting, we learn

Arctic winter warming events – winter days where temperatures peak above 14 degrees Fahrenheit (minus 10 degrees Celsius) – are a normal part of the climate over the ice-covered Arctic Ocean. But new research by an international team that includes NASA scientists finds these events are becoming more frequent and lasting longer than they did three decades ago.

and why does this matter?

Storms that bring warm air to the Arctic not only prevent new ice from forming, but can also break up ice cover that is already present, Graham said. He added that the snowfall from storms also insulates current ice from the cold atmosphere that returns to the Arctic after the cyclones, which can further reduce ice growth.

We know that reduced ice changes albedo, creating a feedback loop (see the Arctic Ice and Global Warming post). The NASA article is from the paper Increasing frequency and duration of Arctic winter warming events where the graph here originates (see supporting information pdf). The data is hard to track down but if you email the authors they may provide you the data used to create these graphs, especially if you mention you want to use it for a linear regression project in a class.

Greenland Ice, Changing Albedo, and a Feedback Loop

The BBC reports: Sea Level Fears as Greenland Darkens. The article discusses a possible feedback loop where as temperatures warm algae growth may flourish, which darkens the surface and changes the albedo to increase melting.

One concern now is that rising temperatures will allow algae to flourish not only on the slopes of the narrow margins of the ice-sheet but also on the flat areas in the far larger interior where melting could happen on a much bigger scale.

We joined the latest phase of research in which scientists set up camp on the ice-sheet to gather accurate measurements of the “albedo” or the amount of solar radiation reflected by the surface.

White snow reflects up to 90% of solar radiation while dark patches of algae will only reflect about 35% or even as little as 1% in the blackest spots.

Other highlights from the article include:

Currently the Greenland ice sheet is adding up to 1mm a year to the rise in the global average level of the oceans.

It is the largest mass of ice in the northern hemisphere covering an area about seven times the size of the United Kingdom and reaching up to 3km (2 miles) in thickness.

This means that the average sea level would rise around the world by about seven metres, more than 20ft, if it all melted.

You can get Greenland Ice Data from NASA’s Vital Signs of the Planet page as noted in a past post.

A Trillion Ton Iceberg

Map of Larsen C, overlaid with NASA MODIS thermal image from July 12 2017, showing the iceberg has calved

If you have been following this blog you might know that we are talking about Larsen C. Project MIDAS reports: Larsen C calves trillion ton iceberg. What does this mean?

The iceberg weighs more than a trillion tonnes (1,000,000,000,000 metric tonnes), but it was already floating before it calved away so has no immediate impact on sea level. The calving of this iceberg leaves the Larsen C Ice Shelf reduced in area by more than 12%, and the landscape of the Antarctic Peninsula changed forever.

The article also notes:

Whilst this new iceberg will not immediately raise sea levels, if the shelf loses much more of its area, it could result in glaciers that flow off the land behind speeding up their passage towards the ocean. This non-floating ice would have an eventual impact on sea levels, but only at a very modest rate.

There is now some interesting modeling of where the iceberg will go and how long it will take to melt.  There should be a good differential equations project in here. Please read the full article, which includes a nice picture of the full break in the ice. Quiz question: What melting ice will have a significant impact on sea level?

Arctic Ice and Global Warming

An article from this past February, Rapid warming and disintegrating polar ice set the stage for ‘societal collapse’ – Carbon pollution is destabilizing both the Arctic and Antarctic, provides a nice overview of issues of warming and ice. For instance, there is the albedo feedback loop:

Climate models have long predicted that if we keep using the atmosphere as an open sewer for carbon pollution, the ice cap would eventually enter into a death spiral because of Arctic amplification — a vicious cycle where higher temperatures melt reflective white ice and snow, which is replaced by the dark land or blue sea, which both absorb more solar energy, leading to more melting.

The graph here is historical January Arctic ice extent and the data can be downloaded from the National Snow and Ice Data Center Sea Ice Data and Analysis Tools page.  Go to Sea ice analysis data spreadsheets and then to monthly data by year. As you’ll see there is other data there worth exploring. There are projects using Arctic ice data on both the calculus and statistics pages on this blog. If you are a real ice junkie take a look at the interactive sea ice graph and keep track of the current ice extent.  Finally, as a reader of this blog you know that you can make your own global temperature maps like the one in the article from reading April Second Warmest on Record.


Glacier Pairs

NASA’s Global Ice Viewer for Glaciers provides stunning pairs of images of glaciers taken many years apart at the same location. The viewer starts with a map of the world with links for seven locations. Each link brings you to glacier pair images from that location with information about the images. For example, here is a pair of images from Bear Glacier in the Alaskan Range. The top image was taken on July 20, 1909 and the second on Aug 5, 2005. Here is what the site says about glaciers:

Glaciers are sentinels of climate change. Ice that took centuries to develop can vanish in just a few years. A glacier doesn’t melt slowly and steadily like an ice cube on a table. Once glacial ice begins to break down, the interaction of meltwater with the glacier’s structure can cause increasingly fast melting and retreat.

Widespread loss of glaciers would likely alter climate patterns in complex ways. Glaciers have white surfaces that reflect the sun’s rays.  This helps keep our current climate mild. When glaciers melt, darker surfaces are exposed, which absorb heat.  This raises temperatures even more.

Larsen C Update

Project MIDAS recently posted Larsen C takes another step towards calving.

In the largest jump since January, the rift in the Larsen C Ice Shelf has grown an additional 17 km (11 miles) between May 25 and May 31 2017. This has moved the rift tip to within 13 km (8 miles) of breaking all the way through to the ice front, producing one of the largest ever recorded icebergs. The rift tip appears also to have turned significantly towards the ice front, indicating that the time of calving is probably very close.

STEM folks are presented with challenging problems modeling and predicting changes in ice and glaciers due to climate change.