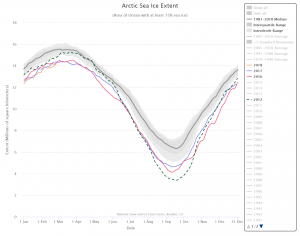
 We are within about a month of the peak of Arctic sea ice in its yearly cycle of freezing and thawing. At the moment, sea ice is at a record low (see chart) tracking close to 2017 and 2016, where as 2012 holds the record for the lowest extent of ice. NSID has an interactive real time chart (the last data point here is Feb 25) where you can select any and all years from 1979 to the present and download the graph. The data can be downloaded in an Excel spreadsheet from their Sea Ice Data and Analysis Tools page where they also have links to animations. There are materials in both the Calculus Projects and Statistics Projects pages using this data.
Tags Arctic climate change data source ice
