Tag Archives: Arctic

Follow Up: How old is Arctic Ice?

In a follow up to our May 28, 2018 post, How old is Arctic Ice?, the Washington Post has an article, The Arctic Ocean has lost 95 percent of its oldest ice — a startling sign of what’s to come by  Chris Mooney (12/11/18). It notes:

In 1985, the new NOAA report found, 16 percent of the Arctic was covered by the very oldest ice, more than four years old, at the height of winter. But by March, that number had dropped to under 1 percent. That’s a 95 percent decline.

At the same time, the youngest, first-year ice has gone from 55 percent of the pack in the 1980s to 77 percent, the report finds. (The remainder is ice that is two to three years old.)

The loss of sea ice creates a feedback loop:

There is a well-known feedback loop in the Arctic, caused by the reflectivity of ice and the darkness of the ocean. When the Arctic Ocean is covered by lighter, white ice, it reflects more sunlight back to space. But when there is less ice, more heat gets absorbed by the darker ocean — warming the planet further. That warmer ocean then inhibits the growth of future ice, which is why the process feeds upon itself.

and

Because of this, Arctic sea ice loss has already increased the warming of the planet as a whole. Ramanathan said the impact is equivalent to the warming effect of 250 billion tons of carbon dioxide emissions, or about six years of global emissions.

Ramanathan fears that entirely ice-free summers, if they began to occur regularly, could add another half- degree Celsius (0.9 degrees Fahrenheit) of warming on top of whatever else the planet has experienced by that time.

The Washington Post article has a few nice animated graphics. The graph and map here is from the sea ice sections of the Arctic Report Card: Update for 2018 – Effects of persistent Arctic warming continue to mount from NOAA. The Arctic Report card contains a half dozen charts and graphs including one that compares March and September sea ice extent. A data and project for this is in our Statistics Project page.

How has Arctic sea ice volume changed?

The Guardian article Arctic’s strongest sea ice breaks up for first time on record by Jonathan Watts (8/21/18) includes an animated graph of Arctic sea ice volume by year. We produce a similar graph using monthly average ice volume from PIOMAS (source cited for the data in the article).  The graph clearly displays the change of ice throughout the year and the loss of ice throughout the years.

Freakish Arctic temperatures have alarmed climate scientists since the beginning of the year. During the sunless winter, a heatwave raised concerns that the polar vortex may be eroding.

This includes the Gulf Stream, which is at its weakest level in 1,600 years due to melting Greenland ice and ocean warming. With lower circulation of water and air, weather systems tend to linger longer.

A dormant hot front has been blamed for record temperatures in Lapland and forest fires in Siberia, much of Scandinavia and elsewhere in the Arctic circle.

The data from PIOMA includes monthly and daily ice volumes.  The R script and csv file that produced the graph here can be downloaded.

How old is Arctic sea ice?

From the NYT: In the Arctic, the Old Ice Is Disappearing

The NYT article In the Arctic, the Old Ice Is Disappearing by Jeremy White and kendra Pierre-Louis (5/14/2018) notes

In the Arctic Ocean, some ice stays frozen year-round, lasting for many years before melting. But this winter, the region hit a record low for ice older than five years.

In fact, in March of 1984 5+ year old ice made up about 30% of all ice and now it makes up only a few percent. There is also less ice overall.

If you really want to explore changes in the age of  Arctic ice go to the NSIDC Satellite Observations of Arctic Change interactive graph.  You can choose a year from 1985 through 2916, see a map of the ice, a bar chart of ice by month by age, and have the graph animate through the months of the year. The differences over the years is extreme. You can get related data from the EASE-Grid Sea Ice Age, Version 3 page, although you will have to register.

What is the state of Arctic Sea Ice?

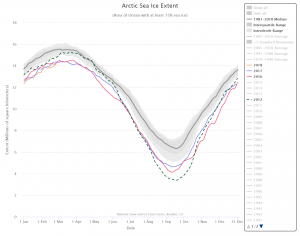
We are within about a month of the peak of Arctic sea ice in its yearly cycle of freezing and thawing. At the moment, sea ice is at a record low (see chart) tracking close to 2017 and 2016, where as 2012 holds the record for the lowest extent of ice. NSID has an interactive real time chart (the last data point here is Feb 25) where you can select any and all years from 1979 to the present and download the graph. The data can be downloaded in an Excel spreadsheet from their Sea Ice Data and Analysis Tools page where they also have links to animations.  There are materials in both the Calculus Projects and Statistics Projects pages using this data.

Arctic Sea Ice Visual

Thanks to the folks at the NASA Scientific Visualization Studio for this visualization of Annual Arctic Sea Ice Minimum 1979-2015 with Area Graph (click on the visual to play). Arctic ice data is available in the calculus and statistics sections. A recent Economist article The thawing Arctic threatens an environmental catastrophe adds some context.

The Arctic has been warming at twice the rate of the rest of the world for decades because of feedback loops that have reduced the albedo effect, a measure of the way Earth reflects heat. Unlike the rest of the planet the polar regions release more heat into space than they absorb, in effect cooling the planet, because sunlight is reflected by ice and snow. When it is replaced by water or dark ground, more heat is retained. That is precisely what is happening in the Arctic’s defrosting landscape.