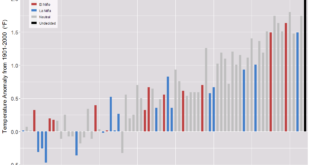
 The Guardian article Arctic’s strongest sea ice breaks up for first time on record by Jonathan Watts (8/21/18) includes an animated graph of Arctic sea ice volume by year. We produce a similar graph using monthly average ice volume from PIOMAS (source cited for the data in the article). The graph clearly displays the change of ice throughout the year and the loss of ice throughout the years.
Freakish Arctic temperatures have alarmed climate scientists since the beginning of the year. During the sunless winter, a heatwave raised concerns that the polar vortex may be eroding.
This includes the Gulf Stream, which is at its weakest level in 1,600 years due to melting Greenland ice and ocean warming. With lower circulation of water and air, weather systems tend to linger longer.
A dormant hot front has been blamed for record temperatures in Lapland and forest fires in Siberia, much of Scandinavia and elsewhere in the Arctic circle.
The data from PIOMA includes monthly and daily ice volumes. The R script and csv file that produced the graph here can be downloaded.
