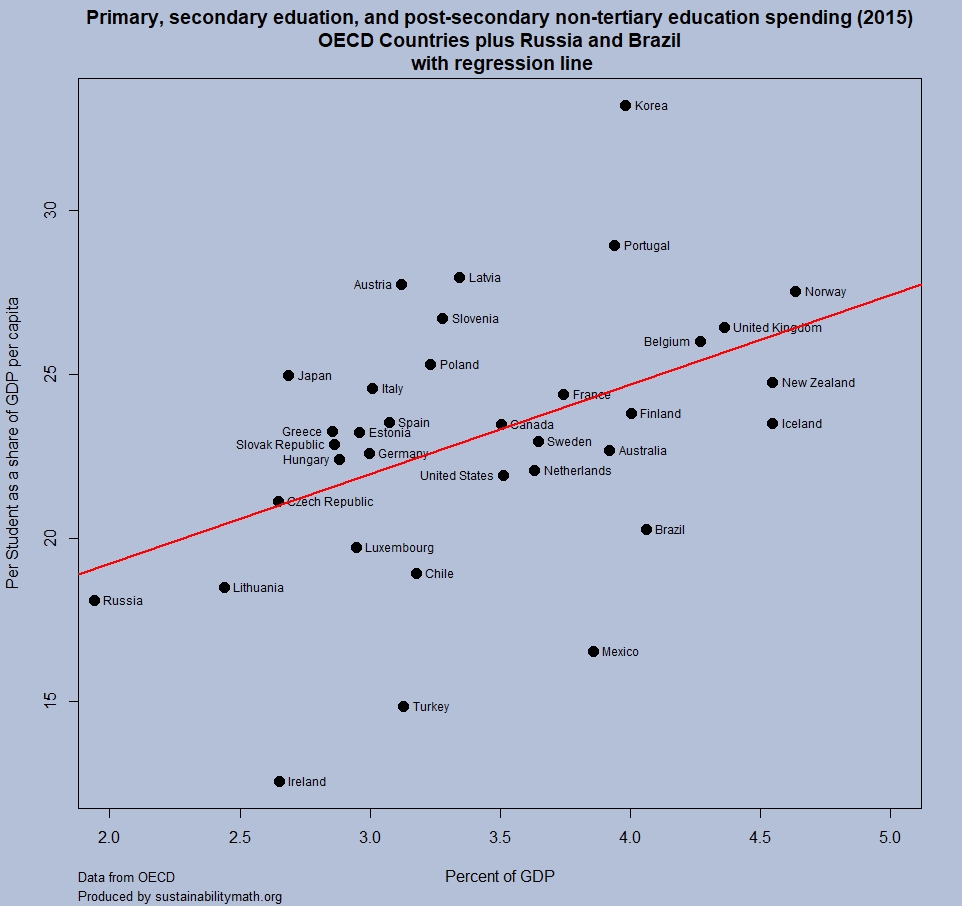
 The answer to the question depends on how it is measured. The post in statista, The Countries Spending the Most on Education by Martin Armstrong (9/12/2018) reports spending as a share of gross domestic product for primary, second and post-secondary non-tertiary education as well as tertiary education. By this measure Norway spends the most. But, if the measure used is expenditure per student as a share of GDP per capita, the high spender is (south) Korea (Norway is fifth). Our graph here is a scatter plot of the two measures by country.
The data is from OECD.Stat. Go to Education and Training, Education at a Glance, Financial resources invested in education, Education finance indicators, and finally Expenditure per student as share of GDP per capita. Under indicator at the top of the spreadsheet the measure can be changed. Definitions of measures can be found in the OECD Handbook for Internationally Comparative Education Statistics (page 99).
