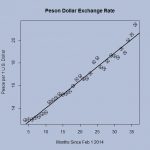
This is not exactly a sustainability example, but it does exhibit the value of some basic regression skills. Drum’s post from yesterday, Fact Check: President Trump Has Nothing To Do With the Decline of the Peso, provides a graph of the Peso Dollar exchange rate for the last couple of years (please read the short post). The graph you see here is made using R and monthly average exchange rate data from FRED or you can download the excel file. Note that the graph here is the number of Pesos to purchase 1 dollar and so the graph increasing is a decline in the Peso.
There are two points here. The change in the peso dollar exchange rate has been reasonably linear for the last couple of years and so there is no evidence that the recent change in the U.S. presidency has had an impact, so far. Second, using examples like this in classrooms empowers students.