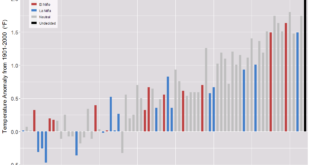
 The graph here represents the number of earthquakes in Oklahoma per year. Another way to represent the same data is in the video below created by the USGS and worth a minute of your time. You can decide which is a more powerful representation of the data. What is causing the increase of earthquakes? Read what the USGS has to say about induced earthquakes. From the myths and misconceptions page:
Fact 1: Fracking is NOT causing most of the induced earthquakes. Wastewater disposal is the primary cause of the recent increase in earthquakes in the central United States.
You can get earthquake data from the Earthquake Catalog. You can select regions and time periods. If you want Excel output then go to the Output Options at the bottom, although the maps are valuable too.
