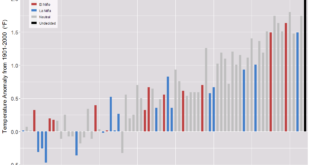
 Climate Central has your answer by providing graphs of the number of above average warm days in the fall since 1970, for most major cities in the U.S. Here is their graph for Duluth MN from their article More Warm Fall Days Across the U.S. In 2016 Duluth had over 70 days in the fall of above average temperatures, almost the entire fall. They don’t provide the data, but you can contact them and they might provide it to you. Alternatively, their methodology is listed and so you can create a graph for your town with some effort (maybe a student project?). There are potential linear regression assignments waiting to be created here that could include comparing cities.
Tags climate change
