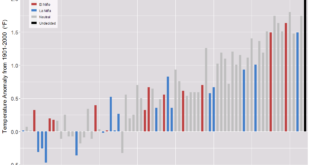
NASA has you covered with their Global Temperature Anomalies from 1880 to 2017 video. We embedded the YouTube version here but there are different versions on their Global Temperature Anomalies from 1880 to 2017 page all of which can be downloaded. This is a product of NASA’s Scientific Visualization Studio.
