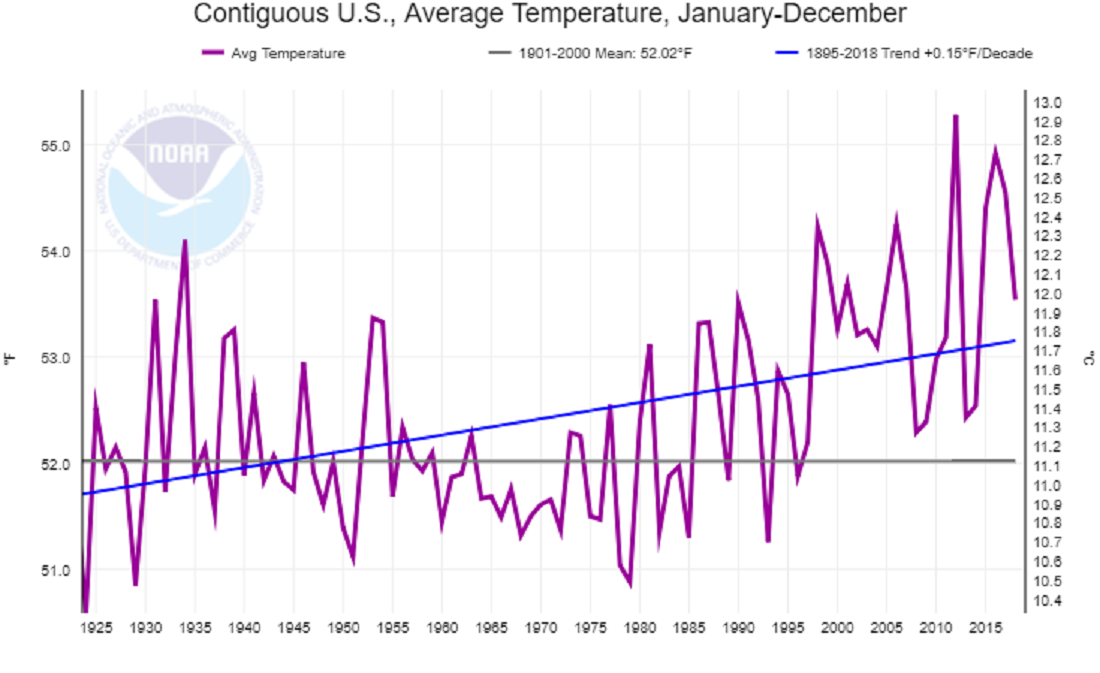
 The NOAA National Centers for Environmental information Climate at a Glance page allows users to select a parameter (ave temp, max temp min temp, precip, etc), a time scale, month, start year, and end year. The output will be a chart and a link for the data. The graph here is the average annual temperature from 1895-2018 for the contiguous U.S. The chart includes a regression line with the slope. For this time period, the slope of the trend line is 0.15 °F per decade. On the other hand, if we choose a time period and a trend line from 1978-2018 the slope is 0.55 °F per decade. There are certainly lots of opportunities for student activities and projects using this page.
About Thomas J. Pfaff
Check Also
The End is Near
I expect to shut down this site by the end of the summer (2026). I …