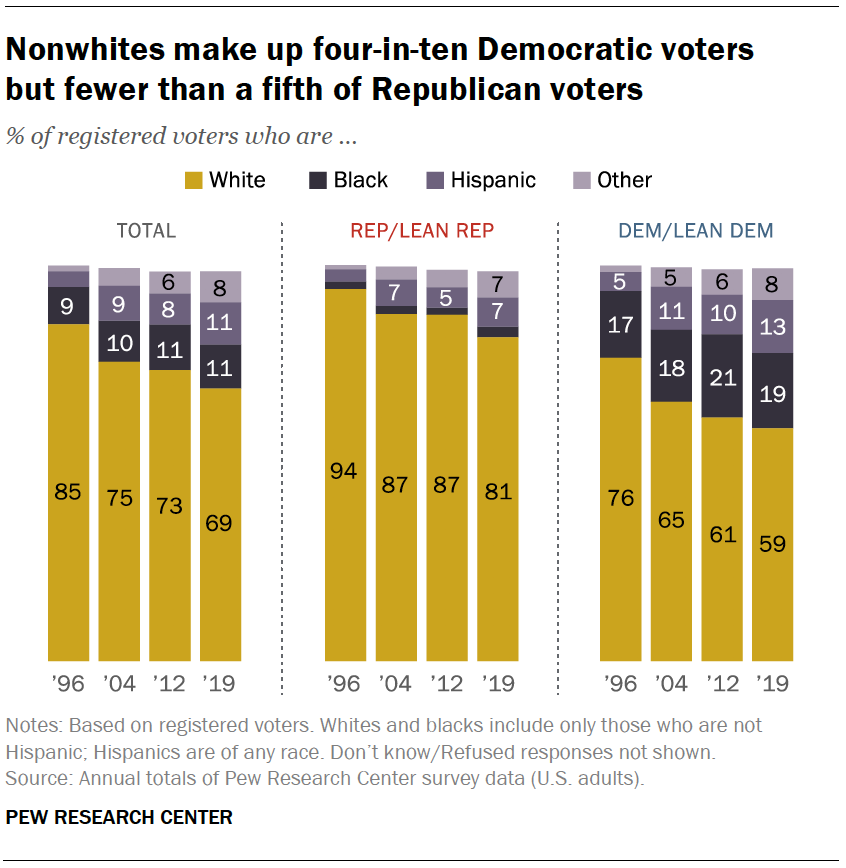
 Pew has a summary of voter demographics by party in their article What the 2020 electorate looks like by party, race and ethnicity, age, education and religion by John Gramlich (10/26/2020). For example, see the graph copied here.
White Americans accounted for 67% of eligible voters nationally in 2018, but they represented a much larger share in several key battlegrounds in the Midwest and Mid-Atlantic, including Wisconsin (86%), Ohio (82%), Pennsylvania (81%) and Michigan (79%). The reverse was true in some battleground states in the West and South. For example, the White share of eligible voters was below the national average in Nevada (58%), Florida (61%) and Arizona (63%). You can see racial and ethnic breakdown of eligible voters in all 50 states – and how it changed between 2000 and 2018 – with this interactive feature.
Check out the interactive graph that is referenced in this quote, along with the half a dozen other graphs in the article. All great for a QL or stats based course.