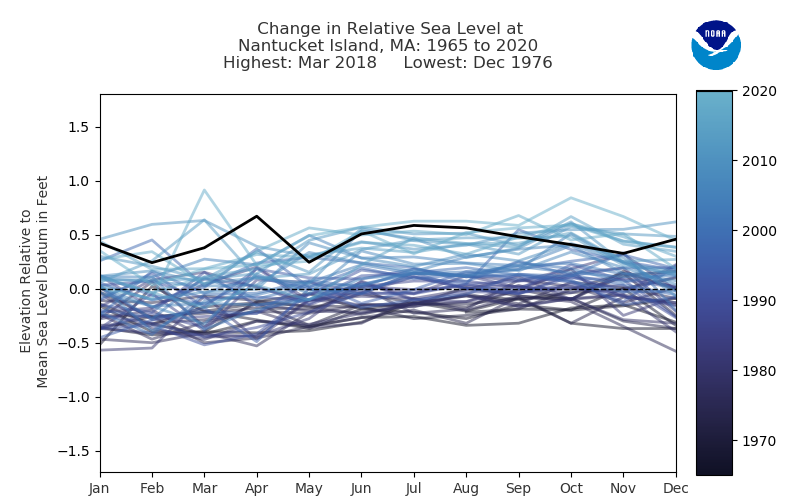
If you live along the cost you might be interested in how much sea level has risen. Climat.gov has the answer on their page Interactive map: How has local sea level in the United States changed over time? by Rebecca Lindsey, et. el. (Updated 3/2/2022). Zoom in on the map at the top of the page and select an arrow and then click on >. This will take you to an animated graph showing has sea level has changed. You can download static versions, such as the one for Nantucket here, and there is a link to the data. Details about regional changes follow the map and are informative. For example, regarding the Gulf of Alaska:
Every coastal location on Earth is being affected by global sea level rise. So why are there a lot of downward arrows around the Gulf of Alaska? Here, global sea level rise is being offset because the land is rebounding as the last remnants of ice-age glaciers disappear. Global sea level is rising, but the land is rising faster, so sea level is falling relative to a fixed local benchmark.