NASA calls this a climate spiral. The visualization is well done, so watch it. The NASA page includes a link to the data used to make the visualization.
Read More »What is a climate spiral?
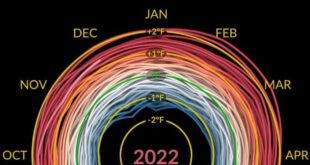
NASA calls this a climate spiral. The visualization is well done, so watch it. The NASA page includes a link to the data used to make the visualization.
Read More »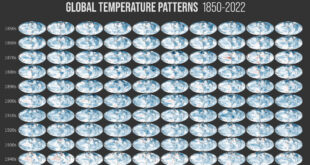
From the NOAA article A look at all 173 of NOAA’s new global temperature maps by Rebecca Lindsey (2/17/2023): Last week, NOAA National Centers for Environmental Information released a major update to the agency’s global surface temperature dataset. The new product tracks temperatures back to 1850, adding 30 additional years to the historical …
Read More »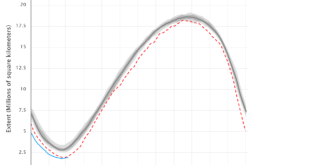
The Antarctic set a new record sea ice minimum at 1.788 million square kilometers beating out last years 1.924 million square kilometers. The graph here comes from the National Snow and Ice Data Center’s (NSIDC) Charctic Interactive Sea Ice Graph. This is a great tool that allows the user to …
Read More »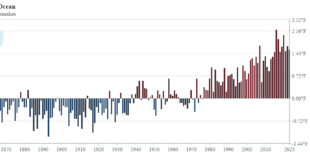
From NOAA’s January 2023 Global Climate Report: January 2023 was the seventh-warmest January for the globe in NOAA’s 174-year record. The January global surface temperature was 1.57°F (0.87°C) above the 20th-century average of 53.6°F (12.0°C). January 2023 marked the 47th consecutive January and the 527th consecutive month with global temperatures, …
Read More »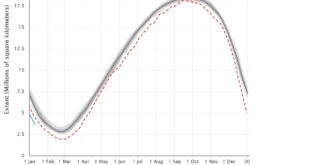
Currently, 2022 is the record minimum for Antarctic sea ice extent, but based on the graph here from the Charctic Interactive Sea Ice Graph from NSIDC 2023 seems primed to beat that record. The Charctic interactive Sea Ice Graph is a fun tool that lets users select years to graph. …
Read More »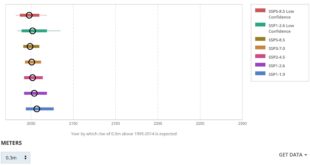
In a follow up to the last post, How much has sea level risen locally? (12/1/2022), we have the IPCC Sea Level Projection Tool. The NOAA sea level trends tool looks at the historic data and adds linear regression lines. The IPCC tool has projections based on the different IPCC …
Read More »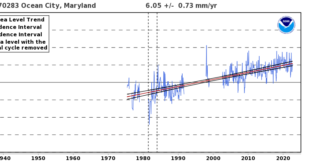
If you’d like local trends of sea level rise then check out NOAA’s Sea Level Trends page. The sea level trends measured by tide gauges that are presented here are local relative sea level (RSL) trends as opposed to the global sea level trend. Tide gauge measurements are made with …
Read More »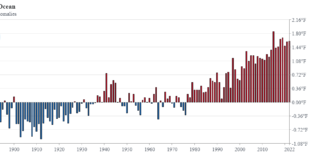
From NOAA’s October 2022 Global Climate Report: October 2022 was the fourth-warmest October in NOAA’s 143-year record. The October global surface temperature was 1.60°F (0.89°C) above the 20th-century average of 57.1°F (14.0°C). The past seven Octobers were among the ten warmest Octobers on record. A few highlights: Europe had its …
Read More »
The UNESCO press release, UNESCO finds that some iconic World Heritage glaciers will disappear by 2050 by François Wibaux (11/3/2022) provides a list of glaciers likely to be gone by 2050. For example, According to available data, glaciers in all World Heritage sites in Africa will very likely be gone …
Read More »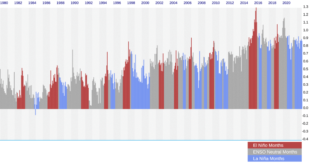
If you pay attention to my monthly global temperature updates you might get the impression that global warming has slowed or even stopped. One key variable here is the ENSO (El Niño – Southern Oscillation). The graph here is from NOAA’s Monthly Temperature Anomalies Versus El Niño | September 2022 …
Read More »