Tag Archives: Demographics

What percent of college students are Hispanic?

The Census Bureau article Gains in Educational Attainment, Enrollment in All Hispanic Groups, Largest Among South American Population by Erik L. Hernandez and Kevin McElrath (5/10/2023) notes

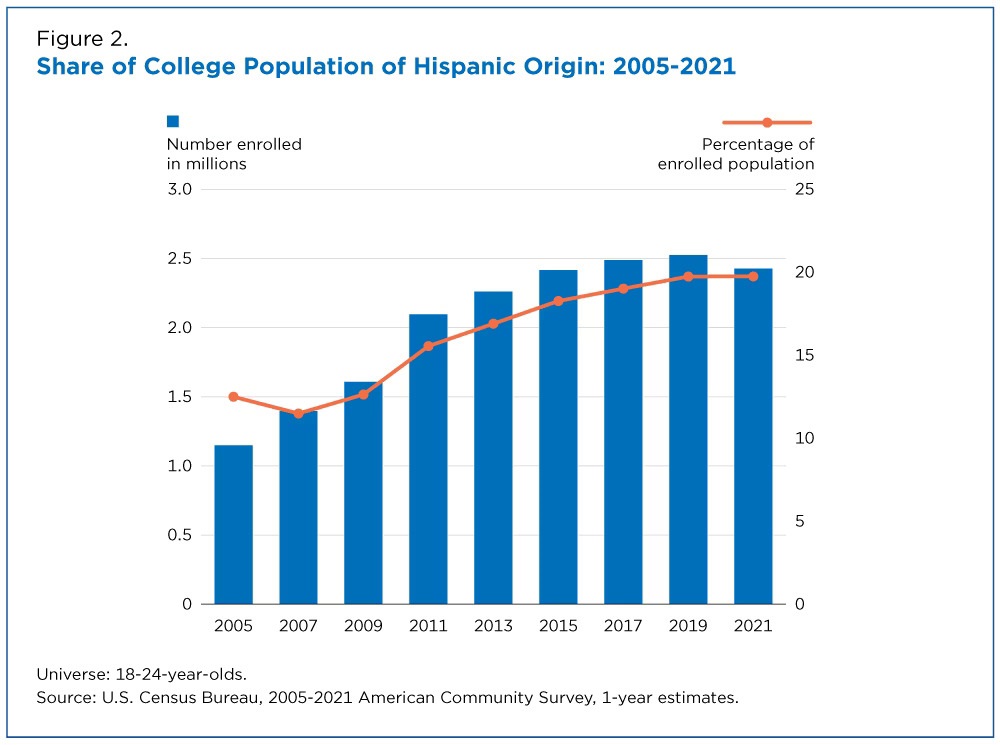
The number of Hispanic people ages 18 to 24 enrolled in college increased to 2.4 million in 2021, up from 1.2 million in 2005.

The share of all college students ages 18 to 24 who were Hispanic grew, too. The lowest share during the period (11.4%) was in 2006; by 2021 it had swelled to nearly 20%.

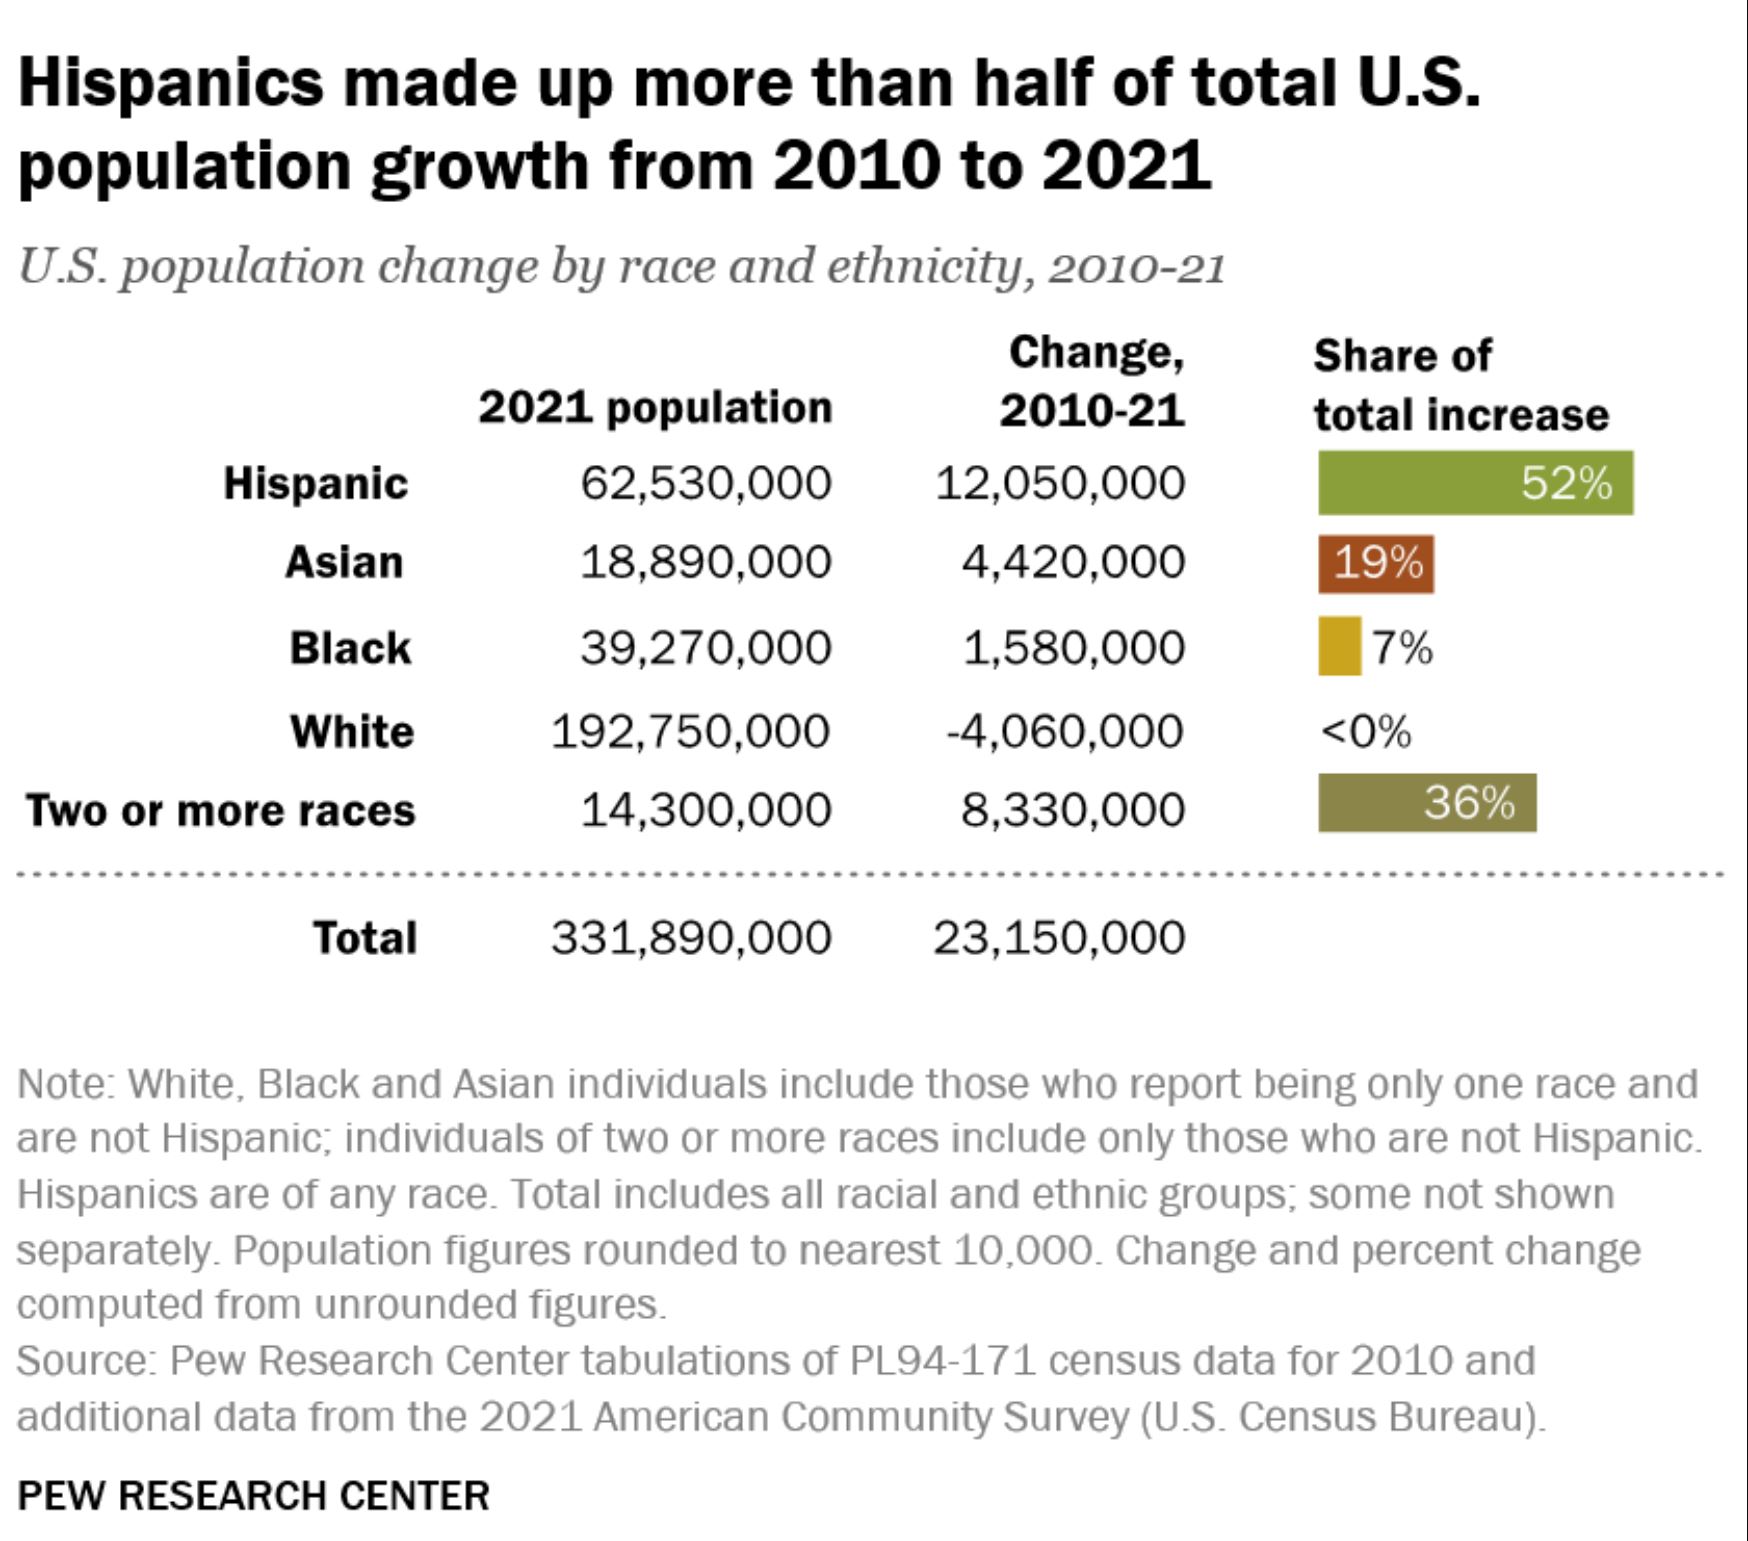
The article notes that in 2021 Hispanics made up 18.7% of the U.S. population, represented by the orange line in the graph. Does this mean that Hispanics are proportionally represented in college? Not necessarily so I’ll leave this as a research project. Hint: Proportions by age matter here.

There are three other graphs and reference to the data in the article.


Who is driving U.S. population growth?

From Pew’s article Key facts about U.S. Latinos for National Hispanic Heritage Month by Jens Manuel Krogstad, Jeffrey S. Passel and Luis Noe-Bustamante (9/23/2022):

The U.S. population grew by 23.1 million from 2010 to 2021, and Hispanics accounted for 52% of this increase – a greater share than any other racial or ethnic group.

There is a great QL point here in that:

The 19% increase in the Hispanic population was faster than the nation’s 7% growth rate, but slower than the 23% increase in the Asian population.

In other words, the  Asian population grew faster but from a smaller count. There are numerous graphics in the article.

What are the most important community issues for Black Americans?

The Pew article Race is Central to Identity for Black American and Affects How They Connect With Each Other by Kiana Cox and Christine Tamir (4/14/2022) is report on an extensive survey with about 37 charts and tables such as the one copied here.

When asked in an open-ended question to identify the most important issue in the community they live in, the top issue was violence or crime (17%). This includes Black Americans who listed specific issues such as drug activity, shootings, or theft; but also those who simply listed “violence” or “crime” as the most pressing issues in their communities. Another 11% of Black adults said economic issues such homelessness, poverty and taxes were most important.

How does this compare to the general public?

The Black population’s rating of the most important issue facing the community they live in is only slightly different from that of the general public. Americans overall name economic issues (15%), violence or crime (12%), and COVID-19 and public health (7%) as the most important issues in their community.

As usual, there is a detailed methodology section.


How big is the Dem/Rep perception gap?

More in Common did a perception gap study in 2018 and while it is a few years old it is worth reading. The graph copied here is the Democrats’ Perception Gap and the page has a similar one for Republicans. One interesting paragraph:

Education is intended to make us better informed about the world, so we’d expect that the more educated you become, the more you understand what other Americans think. In fact, the more educated a person is, the worse their Perception Gap – with one critical exception. This trend only holds true for Democrats, not Republicans. In other words, while Republicans’ misperceptions of Democrats do not improve with higher levels of education, Democrats’ understanding of Republicans actually gets worse with every additional degree they earn. This effect is so strong that Democrats without a high school diploma are three times more accurate than those with a postgraduate degree.

The page has 11 graphs and would make a great QL source for discussion in a class. One key question to ask is if the gap has gotten better or worse over the last few years.

Opioid prescription, grandparents raising grandchildren, a connection?

The Census Bureau report States With High Opioid Prescribing Rates Have Higher Rates of Grandparents Responsible for Grandchildren by Lydia Anderson (4/22/19) draws a connection:

In the wake of the opioid epidemic that was declared a public health crisis in 2017, there has been increasing concern about what happens to the children of parents with substance abuse disorders who may be unable to care for their children.

New Census Bureau research shows that grandparents may sometimes step in to care for these children.

According to the report the states with the highest opioid prescription rates are Alabama (121 per 100 residents), Arkansas (114.6), Tennessee (107.5), Mississippi (105.6) and Louisiana (98.1). These states represent four of the top 5 states where the percentage of the population age 30 and over are raising grandchildren.  The article has a companion map to the map of opioid prescription rates copied here with rates of grandparents raising grandchildren.  There are also links to the data.

More than half the U.S. population lives in what percent of counties?

The answer is the title of the Census Bureau post More Than Half of U.S. Population in 4.6 Percent of Counties by Haya el Nasser (10/24/18). The map copied here shows the counties.

At the county level, the geographic distribution of the estimated 325.2 million people in the United States clearly distinguishes two main areas where people live: “big” counties and “small” counties.

More than half of all residents live in just 143 big counties (in terms of the number of residents), according to an analysis of U.S. Census Bureau county estimates. That means less than half of the population is spread out across the remaining 2,999 small counties.

The post has a short video with more information. For instance the average population density of big counties is 926 people per square mile and only 48 people per square mile for small counties. Small counties are almost 75% non-Hispanic white, while big counties are under 50% non-Hispanic white.

There is also a notable difference in the rate of growth. “Big-county America is growing nearly twice as fast as small-county America,” Sink said. “They’re not only getting bigger but increasingly more diverse.” Thus, if current trends continue, it’s likely that the divide between big and small will continue to become more pronounced in the future.

The post has  another map and some useful tables which include the distribution of small and large counties.

What are the demographics of 6- 21 year olds?

The Pew article Early Benchmarks Show ‘Post-Millennials’ on Track to Be Most Diverse, Best-Educated Generation Yet – A demographic portrait of today’s 6- to 21-year-olds by Richard Fry and Kim Parker (11/15/18)  provides demographic information comparing early boomers, gen xers, millennials, and post millennials.  For example, the graph copied here shows the changes in racial groups across the four generations. The trend toward cities contiues:

The geography and mobility of post-Millennials differ from earlier generations. Reflecting broader national trends, post-Millennials overwhelmingly reside in metropolitan as opposed to rural areas. Only 13% of post-Millennials are in rural areas, compared with 18% of Millennials in 2002. By comparison, 23% of Gen Xers lived in rural areas when they were ages 6 to 21, as did 36% of early Boomers.

The distribution of racial groups by region differs (also see the second graph):

In the West, post-Millennials are just as likely to be Hispanic as non-Hispanic white (both 40%). This stands in contrast to older generations. Among those residing in the West, 45% of Millennials, 50% of Gen Xers and 64% of Boomers are non-Hispanic white. Minority representation among post-Millennials is lowest in the Midwest, where roughly a third (32%) of 6- to 21-year-olds are racial or ethnic minorities.

The Pew report includes 12 charts and a methods section with links to the data.