Tag Archives: Modeling

Where can you find applied math for the classroom?

On my Briefed by Data site, I’ve started doing a monthly post called Classroom Connections. The idea is to list a number of articles where the math could possibly be used in the classroom. The level ranges from engaging graphs and basic math to modeling and data science. For example (related to the graph here),

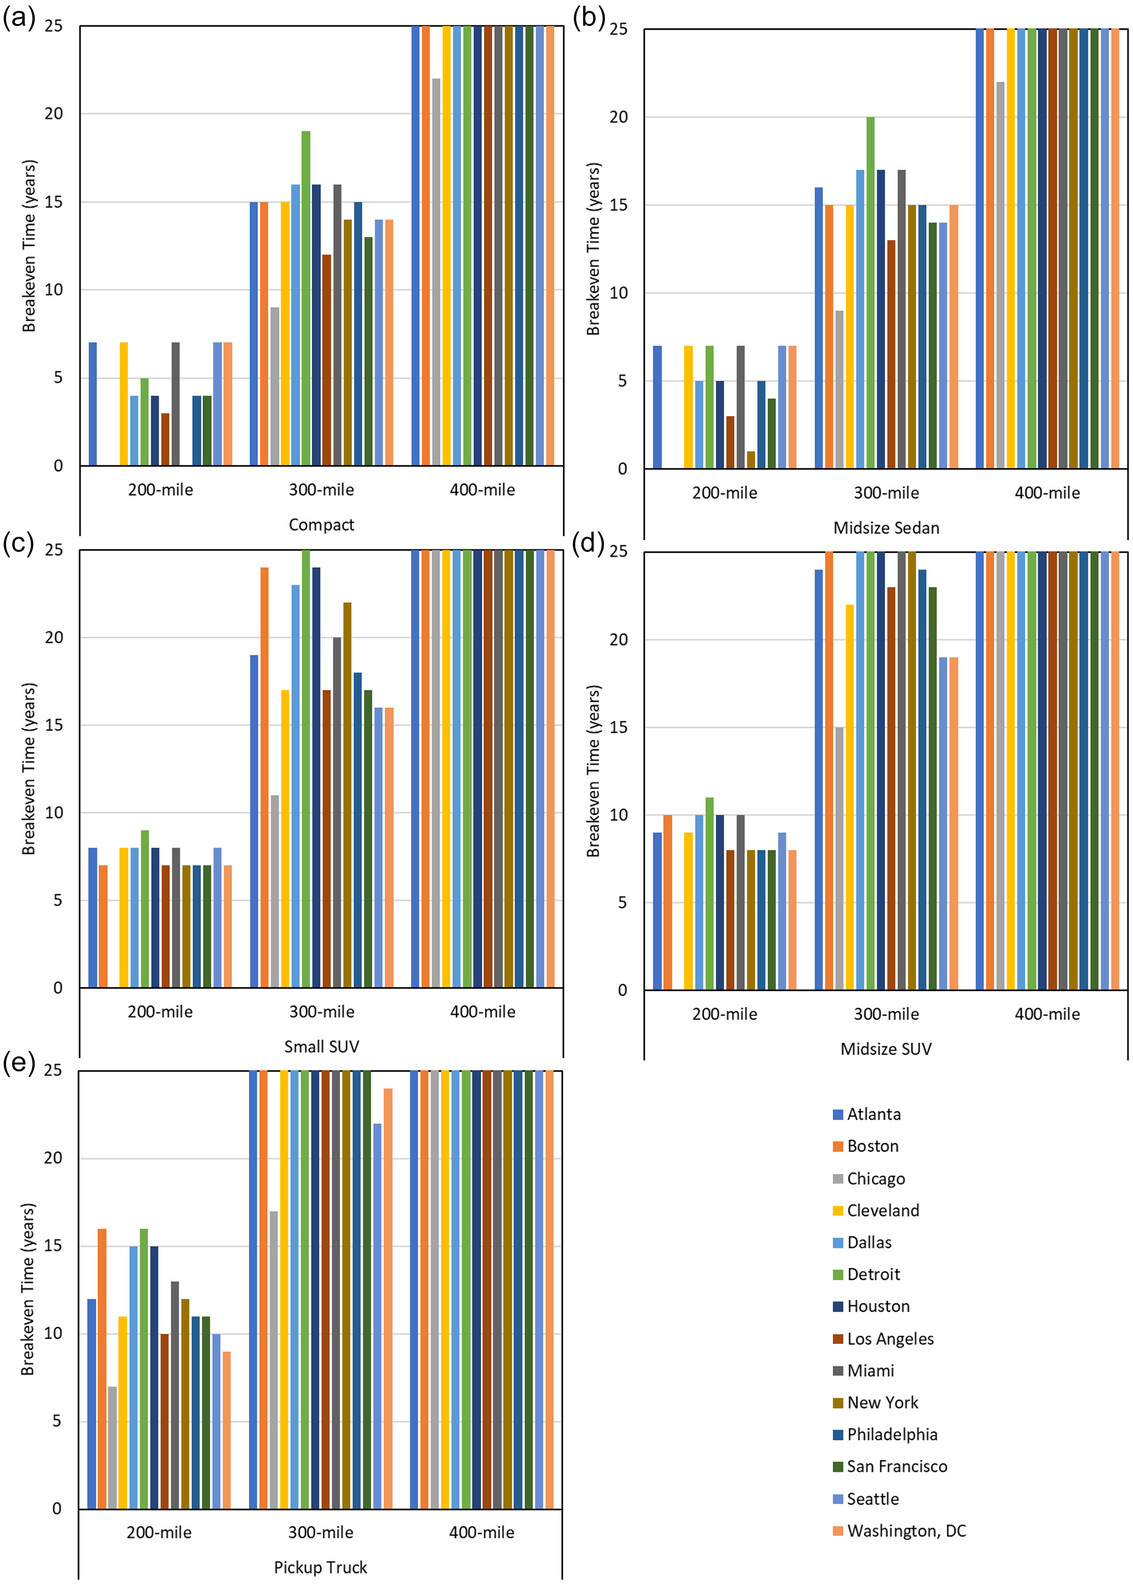
This paper, Electric and gasoline vehicle total cost of ownership across US cities (1/3/2024), goes through the calculations to estimate the return on investment of an electric vehicle. The math is just arithmetic, but a lot can be done with just arithmetic. Great for a project of some sort, and more can be done. For example, if the payoff for the care is 10 years, but you only plan to keep it for 5 years, is it worth it? Can it be resold to make up for the initial investment? What economic level does one need to be at to be able to make the investment in an EV as opposed to an ICE?

Find more examples at Classroom connections for February 3, 2024.

Do you need a simple climate model app for the classroom?

UCAR (University Corporation for Atmospheric Research) has The Very Simple Climate Model page with a climate model where you set the emissions and then run the model until 2100. You get graphs of carbon emissions, CO2 concentration, and temperature. For example, the output in the graph here set emissions at about half the current level. Even then temperature goes up a degree F by 2100. The model can be run 1 year at a time with different emissions each year. There is a link to an activities page as well as some scenarios to explore.

How do we model ocean plastic flow?

The Ocean Cleanup article Forecasting Ocean Plastic Around The GLOBE: A Deep Dive Into Modeling The Garbage Patches by Axel Peytavin (2/12/2021) provides an excellent overview of modeling the movement of plastic to the main garbage patches in the oceans.

We are now ready to delve into the core of the dispersion model: . It revolves around a central differential equation that integrates all phenomena at stake to give an estimate of a particle velocity, or the plastic’s speed through water. Basically, our methods calculate the particle’s velocity at a given time with a formula and use it to estimate where the particle will be a few minutes later. We repeat this process over a long period of time to get a series of positions, i.e., a trajectory of where the plastic goes.

Interesting data storage needs:

As this process has to be repeated over years, the datasets containing wind and speeds all around the globe can take up a lot of space. For instance, the LLC4320 global circulation model uses no less than 5 petabytes of data to be stored. At The Ocean Cleanup, we often use HYCOM data for currents (illustrated below), and GFS for the wind; and our datasets require at least 1.5 terabytes to be stored.

There is an equation and animated graphs.

As an aside here is a page with interesting marine mammal facts: Expert Guide to the Most Interesting Marine Mammals on the Planet.


Where are COVID-19 predictions?

The COVID-19 Projections web page contains daily updates of predictions for COVID-19. For example, the graphs copied here provide predictions for deaths per day, total deaths, and the reproduction number. Users can select projections for individual states and countries. The pages provide full model details which can be useful for any course that studies SIR models. In brief:

To quickly summarize how an SEIR model works, at each time period, an individual in a population is in one of four states: susceptible (S), exposed (E), infectious (I), and recovered (R). If an individual is in the susceptible state, we can assume they are healthy but have no immunity. If they are in the exposed state, they have been infected with the virus but are not infectious. If they are infectious, they can actively transmit the disease. An individual who is infected ultimately either recovers or dies. We assume that a recovered individual’s chances of re-infection is low, but not zero. We can model the movement of individuals through these various states at each time period. The model’s exact specifications depend on its parameters, which we describe in the next section.

The model details page includes clear statements on the fixed parameters and variable parameters, as well as how they are estimated.  Along with the projections page there is an infections tracker page. Overall, there are numerous graphs, projections, and details about modeling.

What do SSPs have to do with modeling climate change?

Global CO2 emissions (gigatonnes, GtCO2) for all IAM runs in the SSP database. SSP no-climate-policy baseline scenarios are shown grey, while various mitigation targets are shown in colour. Bold lines indicate the subset of scenarios chosen as a focus for running CMIP6 climate model simulations. Chart produced for Carbon Brief by Glen Peters and Robbie Andrews from the Global Carbon Project.


The CarbonBrief article Explainer How ‘Shared Socioeconomic Pathways (SSP)’ explore future climate change by Zeke Hausfather (4/19/18) provides a detailed overview of modeling future climate change based on future societies:

The SSPs feature multiple baseline worlds because underlying factors, such as population, technological, and economic growth, could lead to very different future emissions and warming outcomes, even without climate policy.

They include: a world of sustainability-focused growth and equality (SSP1); a “middle of the road” world where trends broadly follow their historical patterns (SSP2); a fragmented world of “resurgent nationalism” (SSP3); a world of ever-increasing inequality (SSP4); and a world of rapid and unconstrained growth in economic output and energy use (SSP5).

The graph copied here is the 5th in a series of 8 as the article explains the modeling process. The article is particularly useful for any course that discusses the modeling process.  Most of the charts are interactive and there is also an animated graphic. There are links to data sources that requires setting up an (free) account.