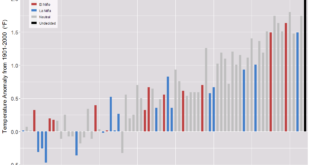
 One of the best ways to engage students in sustainability discussions is to use local information. NOAA has you covered with The Climate Explorer. You can type in your zip code and get historical and projected climate data. Today we highlight temperature. For example, the associated graph is the average annual maximum temperature for Tompkins County (home of this blog). The dark gray boxes are historical data. The blue and red lines are projections based on low and high emission scenarios. You can download the graph (just like we did here) and the data. There are numerous choices including average annual minimum temperatures, days above 95 degrees and days below 32 degrees. You can also select monthly or seasonal data. The site is phenomenal and there must be numerous courses that can take advantage of the graph and data.
Tags climate change data source
