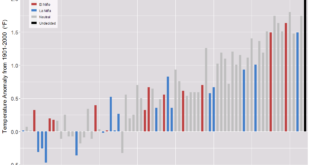
 The Climate Central post, Small Change in Average -Big Change in Extremes, summarizes the idea well with the graph. As the mean shifts to the right, there is a significant increase in the chance of extreme temperature. The animated gif on the site is perfect in expressing the idea.
That’s what we are seeing across much of the country. Average summer temperature have risen a few degrees across the West and Southern Plains, leading to more days above 100°F in Austin, Dallas and El Paso all the way up to Oklahoma City, Salt Lake City, and Boise. It’s worth noting that this trend has been recorded across the entire Northern Hemisphere, as shown in this WXshift animation.
You should check out the WXshift page they link to. This material is perfect for a stats course. It is also worth pointing out that the pictures here assumes the standard deviation stays the same, but there is evidence that it may be increasing. The effect is a flatter more stretched out density, with even greeter likelihood of extremes.
