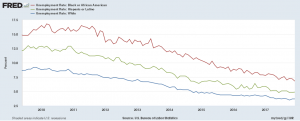
 The data, from the U.S. Bureau of Labor Statistics, and a graph by FRED can enlighten you. FRED has Black, Hispanic, and White unemployment data since 1973. Here we downloaded the graph since the end of the 2008 recession. At its peak (about March 2010) Black unemployment (16.8%) was about twice that of White (8.9%), while Hispanic unemployment was about 50% greater at 12.9%. Currently, Dec 1017, the spread isn’t as bad but the relationships still exists with unemployment rates at 6.8% (Black), 4.9% (Hispanic), and 3.7% (White). The FRED graph is interactive and you can download the data.
Tags data source inequality social justice statistics
About Thomas J. Pfaff
Check Also
The End is Near
I expect to shut down this site by the end of the summer (2026). I …