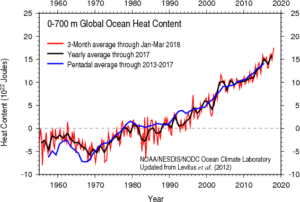
 A year ago Climate Central posted the article Oceans Are Heating Up with a graph of sea surface temperature anomalies while providing context on issues of ocean warming:
93 percent of the excess heat absorbed by the climate system goes into our oceans, creating major consequences. While more extreme storms and rising sea levels are some of the impacts of warmer oceans, rising CO2 levels and the resulting warmer oceans are impacting ocean health itself. The most well known effects are coral bleaching and ocean acidification, but an emerging issue is the decreasing oxygen levels in the warming waters.
The graph here is from NOAA’s Global Ocean Heat and Salt Content page. There you will find numerous updated graphs related to ocean heat content. For related data go to NOAA’s Basin time series of heat content page to find about 50 time series on ocean heat.
For context on units, a person at rest typically generates about 60 joules of heat per minute while the graph here has y-axis units of 10^22 Joules.
