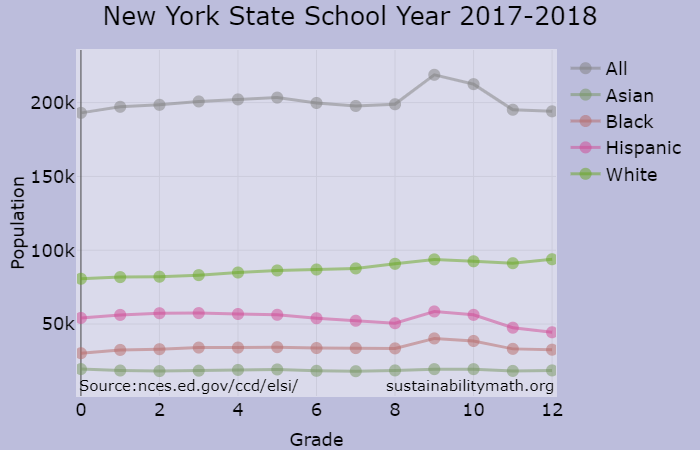
 In a follow up to last week’s graph, I have added a demographic graph of New York State, which provides the number of students in each grade in the 2017-2018 school year by race. The hover information includes percentages for each group. The data comes from the National Center for Education Statistics Elementary/Secondary Information System (ELSi). The link will take you to various table generators and it is easy enough to get data for your state and even data at the district level is available.
Tags charts and graphs data source
About Thomas J. Pfaff
Check Also
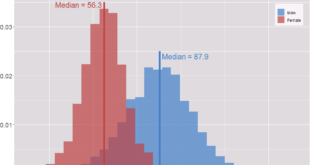
What is the male vs female grip strength difference?
Grip strength is one of the factors measured in the National Health and Nutrition Examination Survey …