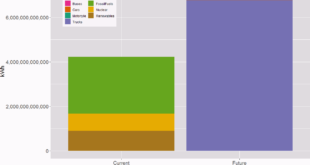
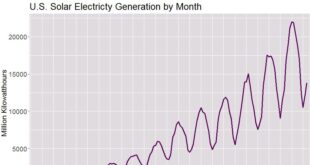
Our World in Data now has a Fossil Fuels Data Explorer. You can create a time series of the top ten oil producers, download the image, and post it on your favorite blog, which I did. Each of the top three more than doubles any producer in the 4-10 spot. …
Read More »What are the sources of methane emissions in the U.S.?
The iea has a Methane Tracker Data Explorer which has information of methane emissions by country or for the world. In 2021 the U.S. emitted 31,460 kt of methane which is 8.8% of the global emissions. There are various graphs, such as the one copied here, and links to download …
Read More »Who is going to use more electricity in the home?
The eia article Use of electricity in houses to grow more quickly in developing economies by Courtney Sourmehi (11/5/2021) is a good example of the difference between totals and per capita. Reference case, we project that residential buildings outside the Organization for Economic Cooperation and Development (OECD) will consume more …
Read More »How much CO2 have we emitted in the last 30 years?
The Institute for European Environmental Policy had this post that I missed in 2020 but it is still good: More than half of all CO2 emissions since 1751 emitted in the last 30 years (4/29/2020). Slightly over half of all cumulative global CO2 emissions have taken place since 1990, the …
Read More »How much LNG do we export?
The eia article U.S. natural gas net trade is growing as annual LNG exports exceed pipeline exports by Kristen Tsai (8/16/2021) has the chart here that answers the question. In our August 2021 Short-Term Energy Outlook (STEO), we forecast that U.S. natural gas exports will exceed natural gas imports by an average …
Read More »What are the challenges to moving to clean energy?
The iea report The Role of Critical Minerals in Clean Energy Transitions (May 2021) notes: Alongside a wealth of detail on mineral demand prospects under different technology and policy assumptions, it examines whether today’s mineral investments can meet the needs of a swiftly changing energy sector. It considers the task …
Read More »What is the source and end-use of CO2 emissions?
The eia diagram U.S. CO2 emissions from energy consumption by source and sector 2020 provides information on the source of CO2 and how that source is used. Archived energy flow diagrams and energy consumption graphs can be found on the Monthly Energy Review page, along with lots of data.
Read More »What are the energy use and emissions projections for 2021?
The IEA Global Energy Review 2021 (April 2021) provides an outlook for 2021 energy use and emissions. Energy use to go up: Global energy demand is set to increase by 4.6% in 2021, more than offsetting the 4% contraction in 2020 and pushing demand 0.5% above 2019 levels. Almost 70% …
Read More »How much wind power was installed in 2020?
From the eia article The United States installed more wind turbine capacity in 2020 than in any other year by Richard Bowers and Owen Comstock (3/32021): In both 2019 and 2020, project developers in the United States installed more wind power capacity than any other generating technology. According to data …
Read More »What are U.S. predicted energy CO2 emissions?
The eia article EIA’s AEO2021 shows U.S. energy-related CO2 emissions rising after the mid-2030s by Perry Lindstrom and Kevin Nakolan (2/11/2021) provides the graph copied here. EIA projects that U.S. energy-related CO2 emissions will increase in the latter years of the projection as a result of increasing economic growth that …
Read More »