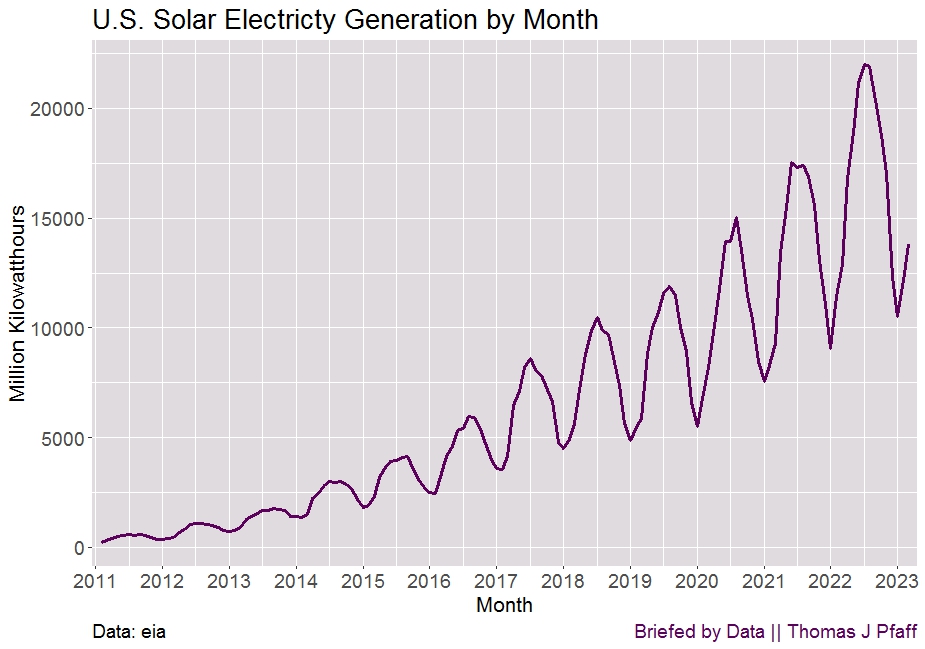
 This is from my Briefed by Data post Seasonal Solar Electricity Generation. It looks like the difference between the maximum month and minimum months of solar electricity generation are growing. In fact, it is fairly consistent in terms of a percentage drop.
In Figure 2, we can see that the annual seasonal drop has averaged 56%, but it’s possible that this number is inflated because 2011 and 2012 had higher values. Since 2018, the drop has been extremely stable, staying between 50% and 55% of the previous level.
There is another graph and a reference to the data. Click the article link or visit the main page of Briefed by Data. Also on twitter @BriefedByData.